. 2024 Jun 28;13(13):1794.
doi: 10.3390/plants13131794.

MaMYBR30, a Novel 1R-MYB, Plays Important Roles in Plant Development and Abiotic Stress Resistance

Affiliations

MaMYBR30, a Novel 1R-MYB, Plays Important Roles in Plant Development and Abiotic Stress Resistance

Li Liu et al. Plants (Basel). .

Abstract

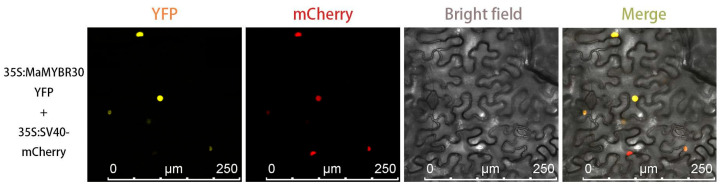
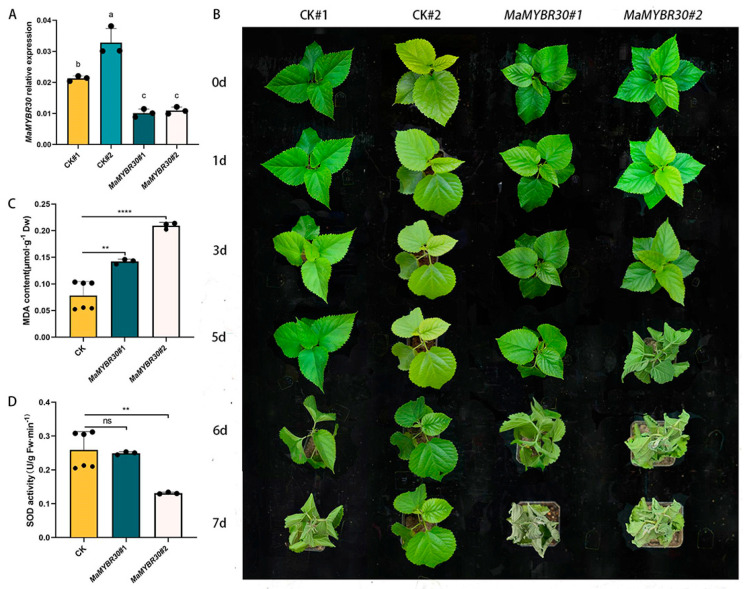
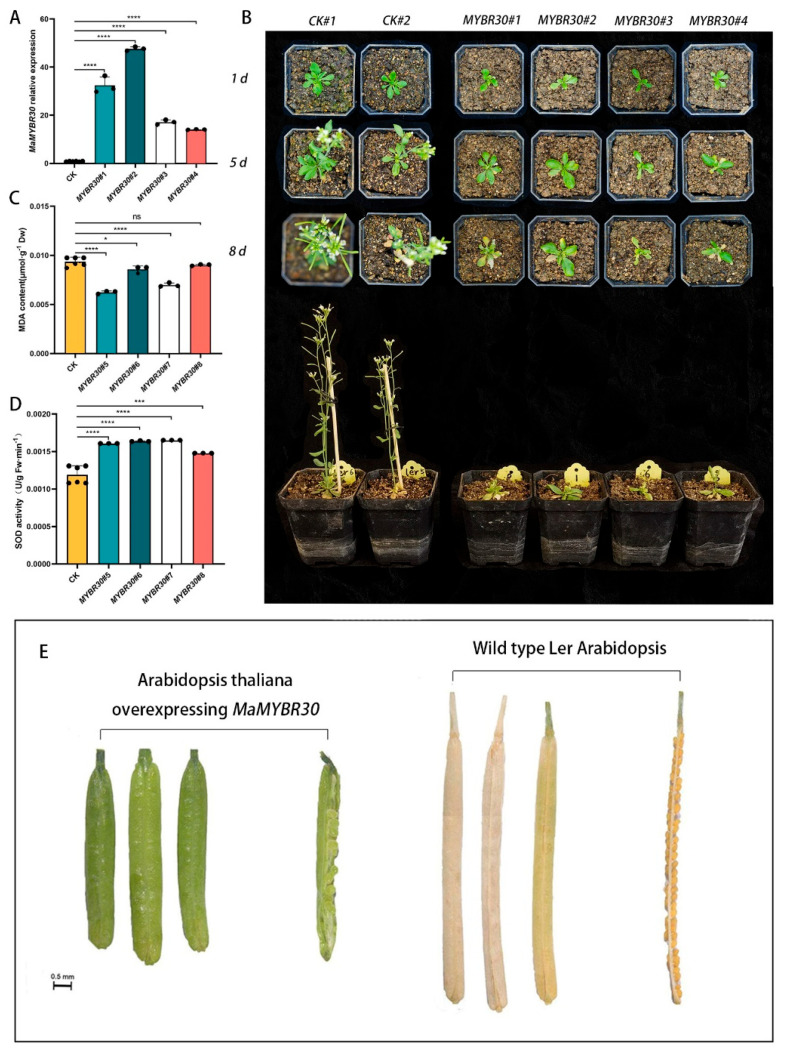
The V-myb myeloblastosis viral oncogene homolog (MYB) family participate in various bioprocesses including development and abiotic stress responses. In the present study, we first report a 1R SHAQKYF-class MYB, MaMYBR30, in mulberry. Subcellular localization and sequence analysis indicated MaMYBR30 is located in the nucleus and belongs to a CCA-like subgroup with a conserved SHAQKYF motif. Expression profile analysis showed that MaMYBR30 is expressed in leaves and can be induced by drought and salt stress. The down-regulation of MaMYBR30 using virus-induced gene silence (VIGS) in mulberry and the overexpression of MaMYBR30 in Arabidopsis were induced to explore the function of MaMYBR30. The functional characterization of MaMYBR30 in vivo indicated that MaMYBR30 can positively regulate the resistance of mulberry to drought while negatively regulating the resistance of mulberry to salt stress. In addition, MaMYBR30 also affects flower development and reproductive growth, especially after exposure to salt stress. Weighted gene co-expression network analysis (WGCNA) primarily revealed the possible genes and signal pathways that are regulated by MaMYBR30. Our results also imply that complex molecular mechanisms mediated by MaMYBR30, including crosstalk of ion toxicity, phytohormone signal transduction, flowering development, and epigenetic modification, need to be further explored in the future.

Keywords: MYB transcription factor; co-expression; drought stress; ion toxicity; salt stress.


Conflict of interest statement

The authors declare that the research was conducted in the absence of any commercial or financial relationships that could be construed as potential conflicts of interest.

Figures

Figure 1
Figure 1
CCA1-like clade MaMYBR30 is involved in drought and salt stress responses. (A). WGCNA indicates the modules’ and the traits’ relationships; species indicate Zhongshen 1 and Wubu varieties and treatment indicates the drought treatments. (B). Venn diagram of DEGs in MEgreen module and the MYBs in mulberry. (C). Phylogenetic analysis of MaMYBR30 and CCA1-like MYB from Arabidopsis thaliana. (D). Expression profile of MaMYBR30 in different organs in mulberry. (E). Expression levels of MaMYBR30 in response to different stresses. (F). Alignment of MaMYBR30 and 1-R MYB from Arabidopsis thaliana. Data are presented as means ± SD of at least three biological replicates. The significance was marked using **** (p < 0.0001) or indicated by different letters.
Figure 2
Figure 2
Subcellular localization of MYBR30. The nucleus location marker SV40-mCherry signals merged with MaMYBR30-YFP signals.
Figure 3
Figure 3
Down-regulation of MaMYBR30 by VIGS decreases drought tolerance in mulberry. (A). qRT-PCR detection of MaMYBR30 expression levels in VIGS-treated mulberry plants. (B). Growth conditions of VIGS-treated mulberry and controls under drought stress; plants were observed and recorded until the seventh day after exposure to drought stress. (C). MDA contents in VIGS-treated mulberry and controls after exposure to drought stress. (D). SOD activities in VIGS-treated mulberry and controls after exposure to drought stress. MDA and SOD were determined in leaves on the seventh day of stress treatment. CK: mulberry plants treated with empty vectors were used as controls; CK#1 and 2 indicated two independent CKs as biological replicates. MaMYBR30 #1 and 2: independent mulberry plants with the down-regulation of MaMYBR30 by VIGS treatment. Data are presented as means ± SD of three biological replicates. The significance was marked using ** (0.001 < p < 0.01), and **** (p < 0.0001) or indicated by different letters.
Figure 4
Figure 4
MaMYBR30 down-regulation by VIGS decreases tolerance to high salt stress. (A). qRT−PCR detection of MaMYBR30 expression levels in VIGS-treated mulberry plants. (B). Growth conditions of VIGS−treated mulberry and controls under high salt stress; plants were observed and recorded until the twelfth day after exposure to drought stress. (C). MDA content in VIGS-treated mulberry and controls after exposure to high salt stress. (D). SOD activity in VIGS−treated mulberry and controls after exposure to high salt stress. MDA and SOD were determined in leaves on the twelfth day of stress treatment. CK: mulberry plants treated with empty vectors were used as controls; CK#1 and 2 indicated two independent CKs as biological replicates. MaMYBR30 #1 and 2: independent mulberry plants with the down-regulation of MaMYBR30 by VIGS treatment. Data are presented as means ± SD of three biological replicates. Significant differences are marked using * (0.01 < p < 0.05), and ** (0.001 < p < 0.01) or indicated by different letters.
Figure 5
Figure 5
MaMYBR30-overexpressing Arabidopsis enhanced plant drought tolerance. (A). qRT−PCR detection of MaMYBR30 expression levels in transgenic Arabidopsis lines. (B). Growth conditions of transgenic Arabidopsis (one line in one pot) and wild types under drought stress for indicated period; (C). MDA contents in transgenic Arabidopsis and wild types after exposure to drought stress. (D). SOD activities in transgenic Arabidopsis and wild types after exposure to drought stress. (E). Growth conditions of transgenic Arabidopsis (four lines in one pot) and wild types under drought stress. Wild types were used as the CK group. MDA and SOD were determined in leaves on the eighth day of stress treatment. Data are presented as means ± SD of three biological replicates. The significance was marked using * (0.01 < p < 0.05), *** (0.0001 < p < 0.001), and **** (p < 0.0001).
Figure 6
Figure 6
MaMYBR30-overexpressing Arabidopsis decreased plant salt tolerance. (A). qRT-PCR detection of MaMYBR30 expression levels in transgenic and wild-type (CK) Arabidopsis lines. (B). Growth conditions of transgenic Arabidopsis (one line in one pot) and wild types under high salt stress for indicated periods. (C). MDA contents in transgenic Arabidopsis and wild types after exposure to high salt stress. (D). SOD activities in transgenic Arabidopsis and wild types after exposure to high salt stress. (E). Pods and seeds of transgenic Arabidopsis and wild types after recovery. The plants were irrigated with 150 mM NaCl instead of water. MDA and SOD were determined in leaves on the eighth day of stress treatment. Data are presented as means ± SD of three biological replicates. The significance was marked using * (0.01 < p < 0.05), *** (0.0001 < p < 0.001), and **** (p < 0.0001) or indicated by different letters.
Figure 7
Figure 7
Comparative transcriptome analysis of mulberry plants with different MaMYBR30 expression levels. (A). Correlation of RNA-seq data from mulberry plants with different MaMYBR30 expression levels. HEP: high expression level of MYBR30; MEP: medium expression level of MYBR30; LEP: low expression level of MYBR30; (B). Number of up-regulated and down-regulated genes in different comparative groups. (C). Correlation of modules and traits. (D). GO and KEGG enrichment of DEGs in the MEturquoise module (up) and DEGs in MEred and MEyellow modules (bottom). “+” indicated KEGG pathways. (E). Co-expression network of MaMYBR30 and top 300 related DEGs. The red circles indicate DEGs in the MEturquoise module, and the blue circles indicate DEGs in the MEred and MEyellow modules.

Similar articles

Cited by

References

    1. Dubos C., Stracke R., Grotewold E., Weisshaar B., Martin C., Lepiniec L. MYB transcription factors in Arabidopsis. Trends Plant Sci. 2010;15:573–581. doi: 10.1016/j.tplants.2010.06.005. - DOI - PubMed
    1. Jiang C.K., Rao G.Y. Insights into the Diversification and Evolution of R2R3-MYB Transcription Factors in Plants. Plant Physiol. 2020;183:637–655. doi: 10.1104/pp.19.01082. - DOI - PMC - PubMed
    1. Liu J., Osbourn A., Ma P. MYB Transcription Factors as Regulators of Phenylpropanoid Metabolism in Plants. Mol. Plant. 2015;8:689–708. doi: 10.1016/j.molp.2015.03.012. - DOI - PubMed
    1. Wang B., Luo Q., Li Y., Yin L., Zhou N., Li X., Gan J., Dong A. Structural insights into target DNA recognition by R2R3-MYB transcription factors. Nucleic Acids Res. 2020;48:460–471. doi: 10.1093/nar/gkz1081. - DOI - PMC - PubMed
    1. Du H., Liang Z., Zhao S., Nan M.G., Tran L.S.P., Lu K., Huang Y.B., Li J.N. The Evolutionary History of R2R3-MYB Proteins Across 50 Eukaryotes: New Insights into Subfamily Classification and Expansion. Sci. Rep. 2015;5:11037. doi: 10.1038/srep11037. - DOI - PMC - PubMed

LinkOut - more resources