

Beneficial Effects of Phosphite in Arabidopsis thaliana Mediated by Activation of ABA, SA, and JA Biosynthesis and Signaling Pathways
- PMID: 38999712
- PMCID: PMC11244317
- DOI: 10.3390/plants13131873
Beneficial Effects of Phosphite in Arabidopsis thaliana Mediated by Activation of ABA, SA, and JA Biosynthesis and Signaling Pathways
Abstract
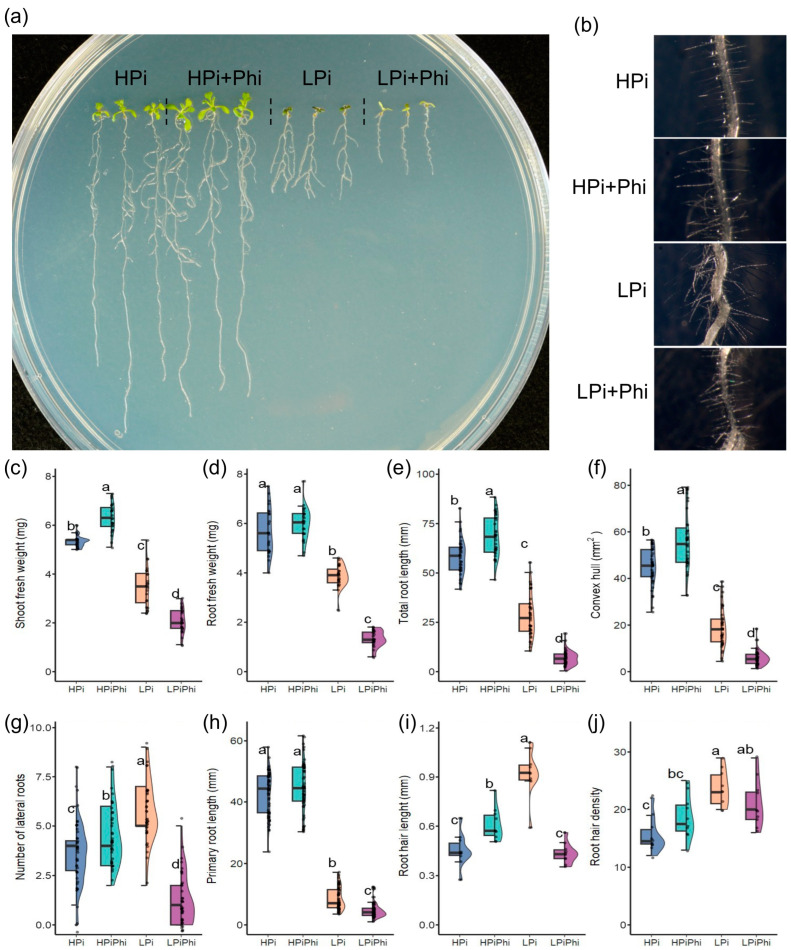
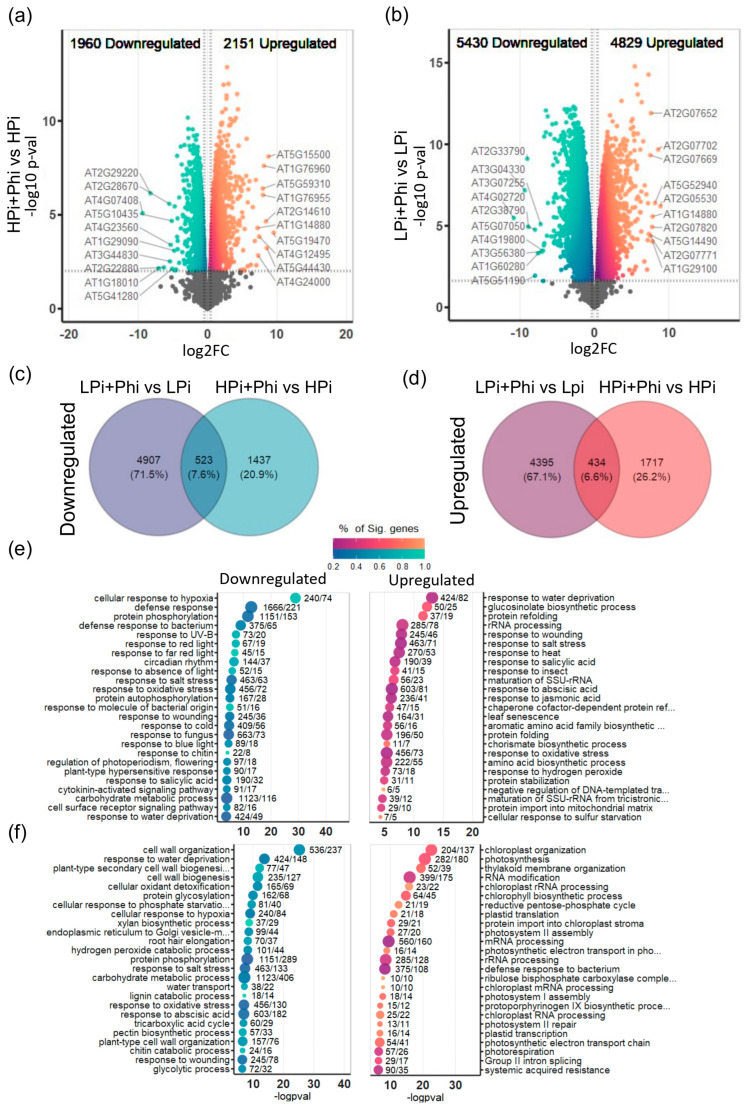
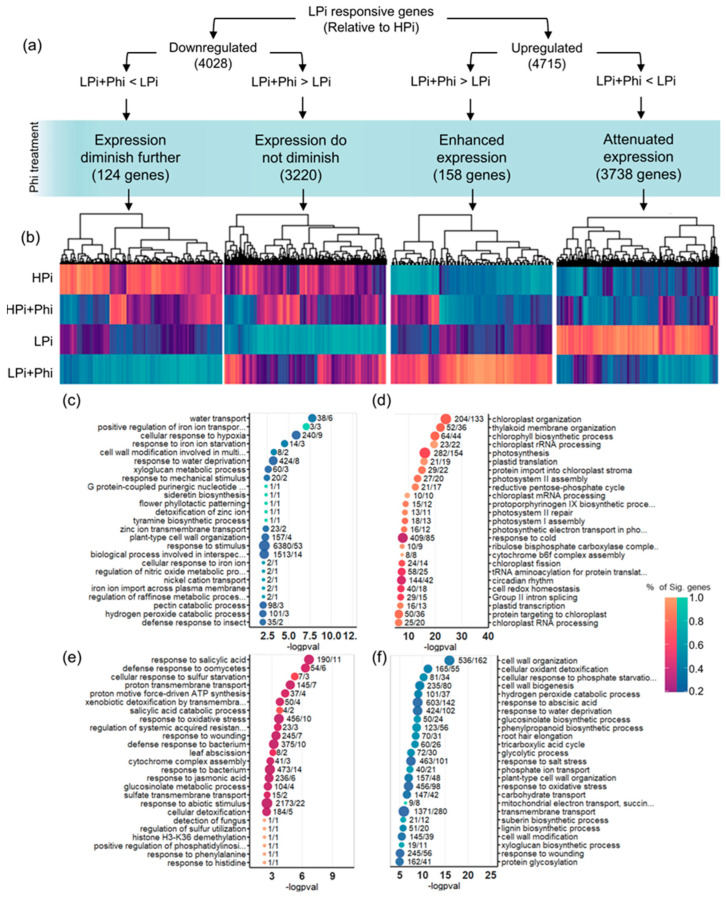
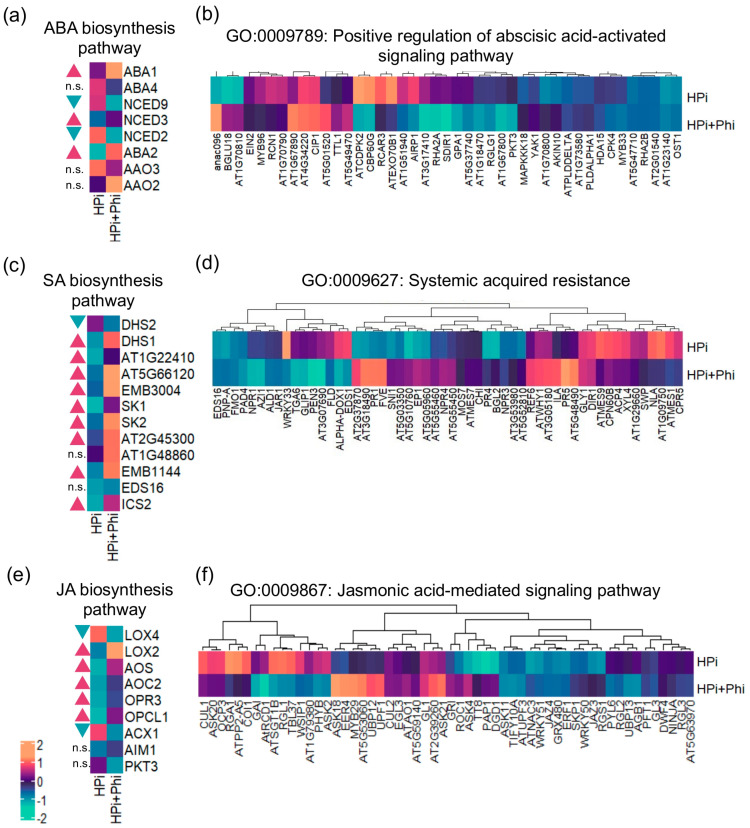
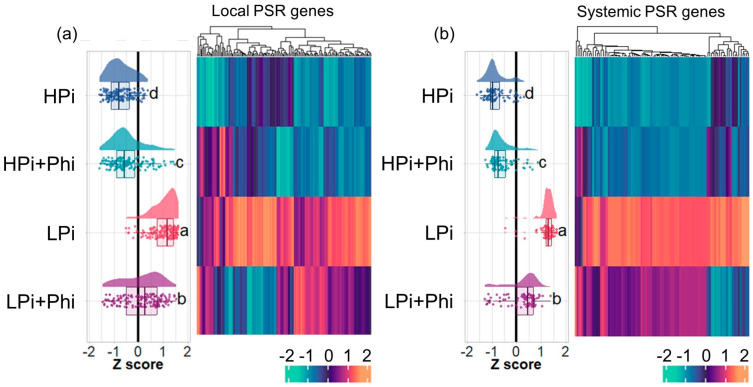
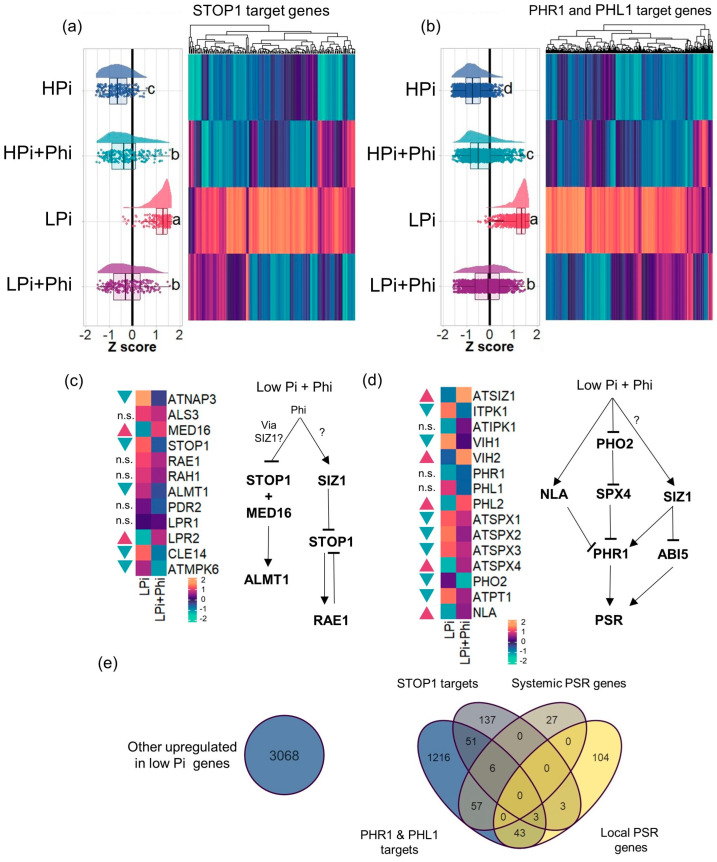
Phosphite (Phi) has gained attention in agriculture due to its biostimulant effect on crops. This molecule has been found to benefit plant performance by providing protection against pathogens, improving yield and fruit quality as well as nutrient and water use efficiency. It is still unclear how Phi enhances plant growth and protects against multiple stresses. It has been hypothesized that Phi acts by directly affecting the pathogens and interacting with the plant cellular components and molecular machinery to elicit defense responses. This study elucidates the mechanisms underlying Phi's beneficial effects on plants, revealing their complex interplay with fundamental signaling pathways. An RNA-seq study of Arabidopsis seedlings under optimal and limiting phosphate conditions helped us unveil Phi's role in promoting plant growth by activating the expression of the genes involved in the biosynthesis and signaling pathways associated with abscisic acid (ABA), salicylic acid (SA), and jasmonic acid (JA). The expression of ABA-related genes, known for their involvement in stress response and development regulation, is triggered by Phi treatment, contributing to enhanced resilience and growth. Simultaneously, the activation of the SA pathway, associated with defense responses, suggests Phi's potential in bolstering plant immunity. Moreover, Phi influences JA biosynthesis and signaling, which are crucial for defense against herbivores and pathogens, thereby strengthening plants' defenses. Our findings reveal a multifaceted mechanism through which Phi benefits Arabidopsis development. Understanding its intricate interplay with key signaling pathways opens avenues for leveraging Phi as a strategic tool to enhance plant resilience, immunity, and growth in agricultural and ecological contexts.
Keywords: Arabidopsis thaliana; abscisic acid; defense responses; jasmonic acid; phosphite; phosphorus sensing; salicylic acid; stress conditions.
Conflict of interest statement
The authors declare that this study received funding from Cotton Incorporated Cary, NC. The funder was not involved in the study design, collection, analysis, interpretation of data, the writing of this article, or the decision to submit it for publication.
Figures
Similar articles
-
Dissecting phosphite-induced priming in Arabidopsis infected with Hyaloperonospora arabidopsidis.Plant Physiol. 2012 May;159(1):286-98. doi: 10.1104/pp.112.194647. Epub 2012 Mar 9. Plant Physiol. 2012. PMID: 22408091 Free PMC article.
-
ROS and Oxidative Response Systems in Plants Under Biotic and Abiotic Stresses: Revisiting the Crucial Role of Phosphite Triggered Plants Defense Response.Front Microbiol. 2021 Jul 1;12:631318. doi: 10.3389/fmicb.2021.631318. eCollection 2021. Front Microbiol. 2021. PMID: 34276579 Free PMC article. Review.
-
Jasmonic acid and salicylic acid play minor roles in stomatal regulation by CO2 , abscisic acid, darkness, vapor pressure deficit and ozone.Plant J. 2021 Oct;108(1):134-150. doi: 10.1111/tpj.15430. Epub 2021 Aug 14. Plant J. 2021. PMID: 34289193 Free PMC article.
-
Signaling Crosstalk between Salicylic Acid and Ethylene/Jasmonate in Plant Defense: Do We Understand What They Are Whispering?Int J Mol Sci. 2019 Feb 4;20(3):671. doi: 10.3390/ijms20030671. Int J Mol Sci. 2019. PMID: 30720746 Free PMC article. Review.
-
Ethylene and jasmonic acid signaling affect the NPR1-independent expression of defense genes without impacting resistance to Pseudomonas syringae and Peronospora parasitica in the Arabidopsis ssi1 mutant.Mol Plant Microbe Interact. 2003 Jul;16(7):588-99. doi: 10.1094/MPMI.2003.16.7.588. Mol Plant Microbe Interact. 2003. PMID: 12848424
Cited by
-
The functional mechanisms of phosphite and its applications in crop plants.Front Plant Sci. 2025 Apr 7;16:1538596. doi: 10.3389/fpls.2025.1538596. eCollection 2025. Front Plant Sci. 2025. PMID: 40260435 Free PMC article. Review.
References
-
- Bogaard A., Fraser R., Heaton T.H.E., Wallace M., Vaiglova P., Charles M., Jones G., Evershed R.P., Styring A.K., Andersen N.H., et al. Crop Manuring and Intensive Land Management by Europe’s First Farmers. Proc. Natl. Acad. Sci. USA. 2013;110:12589–12594. doi: 10.1073/pnas.1305918110. - DOI - PMC - PubMed
-
- Russel D.A., Williams G.G. History of Chemical Fertilizer Development. Soil Sci. Soc. Am. J. 1977;41:260–265. doi: 10.2136/sssaj1977.03615995004100020020x. - DOI
-
- Gómez-Merino F.C., Gómez-Trejo L.F., Ruvalcaba-Ramírez R., Trejo-Téllez L.I. New and Future Developments in Microbial Biotechnology and Bioengineering: Sustainable Agriculture: Revisiting Green Chemicals. Elsevier; Amsterdam, The Netherlands: 2022. Application of Phosphite as a Biostimulant in Agriculture; pp. 135–153. - DOI
-
- Hawkesford M., Horst W., Kichey T., Lambers H., Schjoerring J., Møller I.S., White P. Marschner’s Mineral Nutrition of Higher Plants. 3rd ed. Academic Press; Cambridge, MA, USA: 2011. Functions of Macronutrients; pp. 135–189. - DOI
Grants and funding
LinkOut - more resources
Full Text Sources
