Meta-Analysis
. 2024 Jul 1;16(13):2101.
doi: 10.3390/nu16132101.

Intermittent Fasting Attenuates Obesity-Induced Triple-Negative Breast Cancer Progression by Disrupting Cell Cycle, Epithelial-Mesenchymal Transition, Immune Contexture, and Proinflammatory Signature

Affiliations
Meta-Analysis

Intermittent Fasting Attenuates Obesity-Induced Triple-Negative Breast Cancer Progression by Disrupting Cell Cycle, Epithelial-Mesenchymal Transition, Immune Contexture, and Proinflammatory Signature

Deok-Soo Son et al. Nutrients. .

Abstract

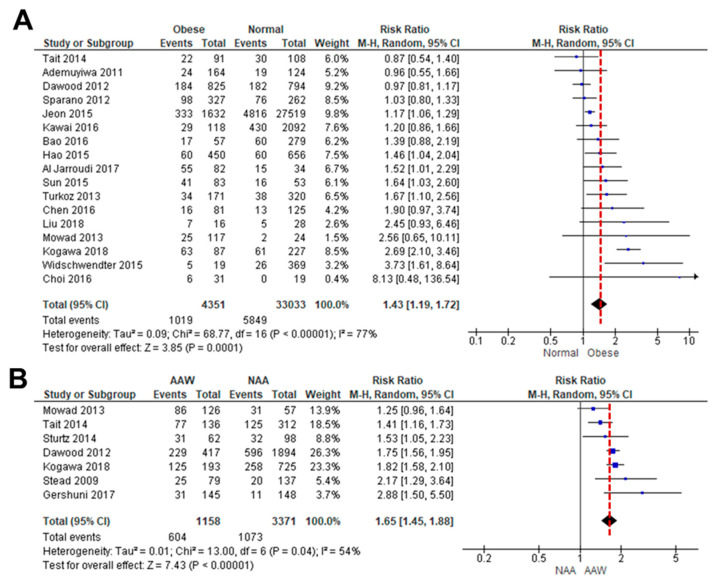
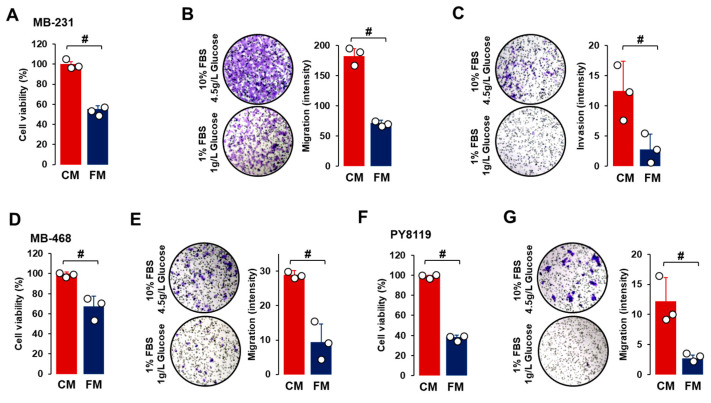
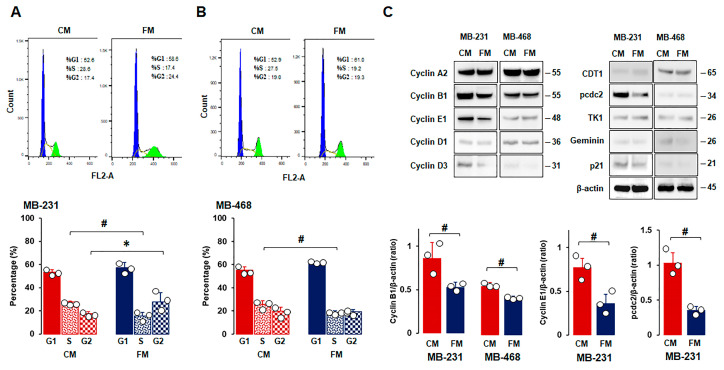
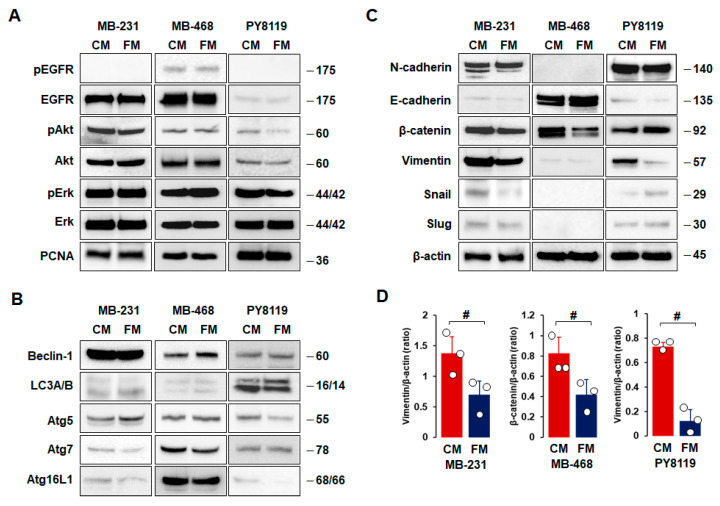
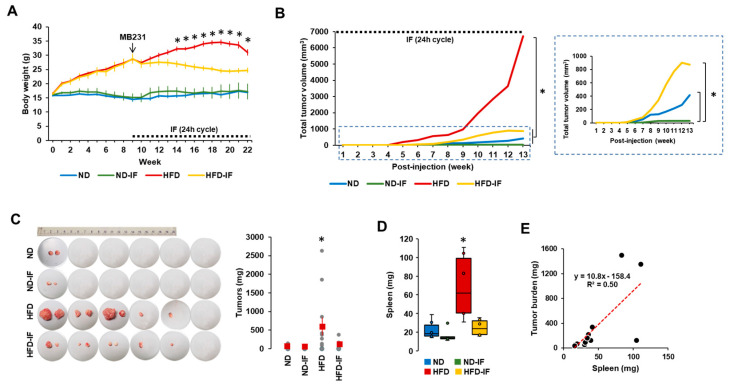
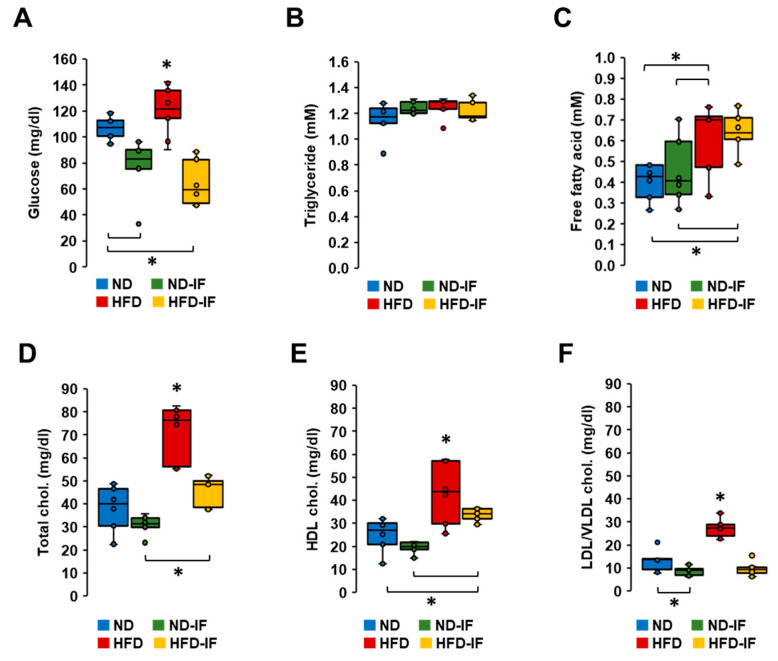
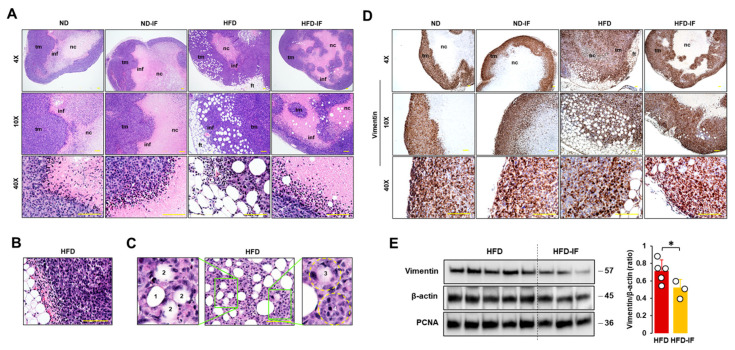
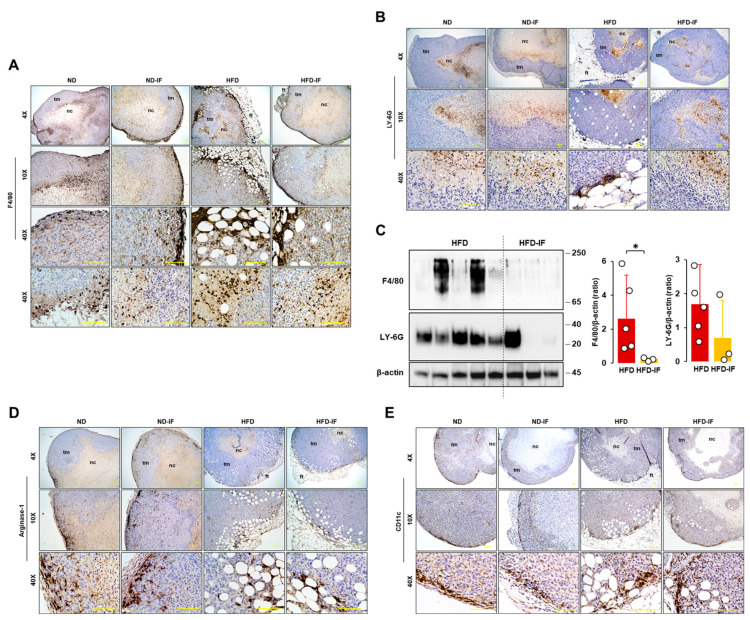
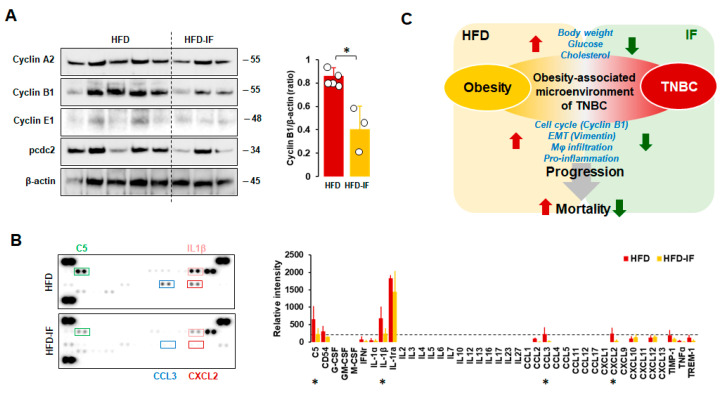
Obesity is associated with one-fifth of cancer deaths, and breast cancer is one of the obesity-related cancers. Triple-negative breast cancer (TNBC) lacks estrogen and progesterone receptors and human epidermal growth factor receptor 2, leading to the absence of these therapeutic targets, followed by poor overall survival. We investigated if obesity could hasten TNBC progression and intermittent fasting (IF) could attenuate the progression of obesity-related TNBC. Our meta-analysis of the TNBC outcomes literature showed that obesity led to poorer overall survival in TNBC patients. Fasting-mimicking media reduced cell proliferation disrupted the cell cycle, and decreased cell migration and invasion. IF decreased body weight in obese mice but no change in normal mice. Obese mice exhibited elevated plasma glucose and cholesterol levels, increased tumor volume and weight, and enhanced macrophage accumulation in tumors. The obesity-exacerbated TNBC progression was attenuated after IF, which decreased cyclin B1 and vimentin levels and reduced the proinflammatory signature in the obesity-associated tumor microenvironment. IF attenuated obesity-induced TNBC progression through reduced obesity and tumor burdens in cell and animal experiments, supporting the potential of a cost-effective adjuvant IF therapy for TNBC through lifestyle change. Further evidence is needed of these IF benefits in TNBC, including from human clinical trials.

Keywords: epithelial–mesenchymal transition; intermittent fasting; obesity; proinflammatory signature; triple-negative breast cancer.


Conflict of interest statement

The authors declare no conflict of interest.

Figures

Figure 1
Figure 1
Meta-analysis for the association between obesity and TNBC. (A) Forest plot for a risk ratio on OS between obese and lean patients with TNBC. Seventeen cohort studies with a total sample size of 37,384 participants met the eligibility criteria to be included in quantitative analysis, with an ascending order. (B) Forest plot for a risk ratio of obesity between AA (AAW) and non-AA women (NAA) in the incidence of TNBC. Seven cohort studies with a total sample size of 4529 participants were included in quantitative analysis, with an ascending order. Patients with normal and obese weights were considered as <25 of BMI and >30 of BMI, respectively [8,35,36,37,38,39,40,41,42,43,44,45,46,47,49,51,52,53,54,55].
Figure 2
Figure 2
Comparison between CM and FM in TNBC progression. (AC) Comparative effects of CM and FM on cell proliferation, cell migration, and cell invasion in MB-231 cells, respectively. (D,E) Comparative effects of CM and FM on cell proliferation and migration in MB-468 cells, respectively. (F,G) Comparative effects of CM and FM on cell proliferation and migration in PY8119 cells, respectively. Cells were incubated for 48 h for cell proliferation and 24 h for cell migration and invasion in each cell line. A cell proliferation assay was performed using MTT, and values were normalized to controls without cells. Cell migration and invasion assays were conducted in Matrigel-free and -coated Transwell systems, respectively. Quantitative analysis of intensity was performed using ImageJ through the color threshold, followed by particle analysis. Experiments were performed in triplicate (n = 3), and all data are shown as mean ± standard deviation (SD). # p < 0.05 in each group calculated by the paired Student’s t-test. CM: complete conditioned media with 4 g/L glucose and 10% FBS; FM: fasting-mimicking conditioned media with 1 g/L glucose and 1% FBS.
Figure 3
Figure 3
Comparison between CM and FM in cell cycle stages and phase-related proteins in TNBC cells. (A,B) Flow cytometry analysis between CM and FM on cell cycle in MB-231 and MB-468 cells, respectively. Cells were treated with CM and FM for 24 h. Flow cytometry assays were performed to determine the percentage of cells in each phase. Representative histograms are shown. (C) Comparative effects of CM and FM on the cell cycle phase-related protein expressions in MB-231 and MB-468 cells, respectively. Whole-cell lysates were prepared, and Western blots were carried out using antibodies specific to cell cycle phase-related proteins. β-actin was used as a loading control. Representative pictures are shown. Experiments were performed at least in triplicate (n = 3), and all data are shown as mean ± SD. * and # p < 0.05 in each group calculated by the paired Student’s t-test. CM: complete conditioned media with 4 g/L glucose and 10% FBS; FM: fasting-mimicking conditioned media with 1 g/L glucose and 1% FBS; CDT1: cell division control protein 10 (cdc10)-dependent transcript 1 protein; pcdc2: phospho-cdc2; TK1: thymidine kinase 1.
Figure 4
Figure 4
Comparison between CM and FM on cell survival, autophagy, and EMT in TNBC cells. (AC) Comparative effects of CM and FM on protein expression levels related to cell survival, autophagy, and EMT in MB-231, MB-468, and PY8119 cells, respectively. Cells were treated with CM and FM for 24 h. Whole-cell lysates were prepared, and Western blots were carried out using antibodies specific to cell survival-, autophagy-, and EMT-related proteins. β-actin was used as a loading control. Representative pictures are shown. (D) A significant difference between CM and FM on vimentin and β-catenin expression levels in MB-231, MB-468, and PY8119 cells. Experiments were performed at least in triplicate (n = 3), and all data are shown as mean ± SD. # p < 0.05 in each group as calculated by the paired Student’s t-test. CM: complete conditioned media with 4 g/L glucose and 10% FBS; FM: fasting-mimicking conditioned media with 1 g/L glucose and 1% FBS; EGFR: epidermal growth factor receptor; pEGFR: phospho-EGFR; PCNA: proliferating cell nuclear antigen; LC3A/B: light chain 3A/B.
Figure 5
Figure 5
The tumor potential profiles of TNBC in ND, ND-IF, HFD, and HFD-IF mice. (A) Body weight trends between ND, ND-IF, HFD, and HFD-IF mice treated with human MB-231 TNBC cells. After confirming a body weight gain at 9 weeks (n = 6/group), MB-231 cells were injected into both 4th mammary fat pads. Alternate-day fasting (24 h fasting and feeding cycle) was applied in fasting groups. * p < 0.05 between non-IF and IF in each ND and HFD group as calculated by the paired Student’s t-test. (B) Total tumor volume among ND, ND-IF, HFD, and HFD-IF mice. Dot square indicates magnificent graph for total tumor volume among ND, ND-IF, HFD, and HFD-IF mice. * p < 0.05 as calculated by the log–rank test. (C) Tumor burden among ND, ND-IF, HFD, and HFD-IF mice. (D) Spleen weight between ND, ND-IF, HFD, and HFD-IF mice by boxplots. * p < 0.05 between groups as analyzed by ANOVA and Tukey’s pairwise comparison tests. (E) Correlation of tumor and spleen weights. R-squared values were calculated from linear regression using the Data Analysis Tools in MS Excel. IF: intermittent fasting of 24 h cycle.
Figure 6
Figure 6
Biochemical characteristics of TNBC-derived sera in diet-induced obese and orthotopic mammary fat pad models. (A) Glucose, (B) triglyceride, (C) free fatty acid, (D) total cholesterol, (E) HDL cholesterol, (F) LDL/VLDL cholesterol levels in TNBC-derived sera of ND, ND-IF, HFD, and HFD-IF mice (n = 6/each group) using quantitative colorimetric assays with duplicate measurements. Box plots were graphed from MS Excel. * p < 0.05 between groups as analyzed by ANOVA and Tukey’s pairwise comparison tests. IF: intermittent fasting of 24 h cycle; HDL: high-density lipoprotein; LDL: low-density lipoprotein; VLDL: very-low-density lipoprotein.
Figure 7
Figure 7
Histological evaluation of tumor tissues in diet-induced obese and orthotopic mammary fat pad models. (A) Histological features of tumor tissues in ND, ND-IF, HFD, and HFD-IF mice using H&E stain. (B) Abundant blood vessels between fat and tumor tissues in HFD-fed mice. (C) Invasive tumor cells into lipid droplets in HFD-fed mice. 1: intact lipid droplet, 2: initial invasion of tumor cells, 3: deeper invasion of tumor cells, 4: ball shape to show occupancy of tumor cells in lipid droplet. (D) Disposition of vimentin-positive cells in tumor tissues from ND, ND-IF, HFD, and HFD-IF mice using immunohistochemistry. (E) Comparative effects of HFD and HFD-IF on vimentin expression levels in tumor tissues. Tumor lysates were prepared, and Western blots were carried out using antibodies specific to vimentin and PCNA. β-actin was used as a loading control. All data are shown as mean ± SD. * p < 0.05 in each group as calculated by the paired Student’s t-test. IF: intermittent fasting of 24 h cycle; tm: tumor tissue; ft: fat tissue; inf: tumor-infiltrating immune cells; nc: necrotic region.
Figure 8
Figure 8
Immunohistochemical evaluation of immune cells in tumor tissues from diet-induced obese and orthotopic mammary fat pad models. Histological features of (A) F4/80 and (B) LY-6G-positive cells in tumor tissues from ND, ND-IF, HFD, and HFD-IF mice. (C) Comparative effects of HFD and HFD-IF on F4/80 and LY-6G expression levels in tumor tissues. Tumor lysates were prepared, and Western blots were carried out using antibodies specific to F4/80 and LY-6G. β-actin was used as a loading control. All data are shown as mean ± SD. * p < 0.05 in each group as calculated by the paired Student’s t-test. Histological features of (D) arginase- and (E) CD11c-positive cells in tumor tissues from ND, ND-IF, HFD, and HFD-IF mice. IF: intermittent fasting of 24 h cycle; tm: tumor tissue; ft: fat tissue; nc: necrotic region.
Figure 9
Figure 9
Comparison between HFD and HFD-IF of the cell cycle and cytokine signature. (A) Comparative effects of HFD and HFD-IF on cell cycle-related protein expression levels in tumor tissues. Tumor lysates were prepared, and Western blots were carried out using antibodies specific to cell cycle phase-related proteins. β-actin was used as a loading control. Column graph indicates a significant difference between HFD (n = 5) and HFD-IF (n = 3) on cyclin B1 expression levels. All data are shown as mean ± SD. * p < 0.05 in each group as calculated by the paired Student’s t-test. (B) Cytokine signatures of tumor tissues in HFD and HFD-IF mice by proteomic array. Relative intensity of spots to express cytokine levels was calculated by ImageJ. All data are shown as mean ± SD. Total spots from HFD and HFD-IF are n = 10/protein and n = 6/protein, respectively. * p < 0.05 in each group as calculated by the paired Student’s t-test in samples above the threshold value (relative intensity = 200, dot line). Representative pictures were selected from among tumor tissues from HFD and HFD-IF mice. C5: complement component 5; CD54: cluster of differentiation 54 or intercellular adhesion molecule 1 (ICAM-1); G-CSF: granulocyte colony-stimulating factor; GM-CSF: granulocyte-macrophage CSF; M-CSF: macrophage CSF; IFNγ: interferon-gamma; IL-1ra: interleukin-1 receptor antagonist; CCL: C-C motif chemokine ligand; CXCL: C-X-C motif chemokine ligand; TIMP1: tissue inhibitor matrix metalloproteinase 1; TNFα: tumor necrosis factor α; TREM-1: triggering receptor expressed on myeloid cells. (C) Schematic for inhibitory effects of IF on HFD-induced TNBC progression.

References

    1. Blüher M. Obesity: Global epidemiology and pathogenesis. Nat. Rev. Endocrinol. 2019;15:288–298. doi: 10.1038/s41574-019-0176-8. - DOI - PubMed
    1. Włodarczyk M., Nowicka G. Obesity, DNA Damage, and Development of Obesity-Related Diseases. Int. J. Mol. Sci. 2019;20:1146. doi: 10.3390/ijms20051146. - DOI - PMC - PubMed
    1. Lauby-Secretan B., Scoccianti C., Loomis D., Grosse Y., Bianchini F., Straif K. Body Fatness and Cancer--Viewpoint of the IARC Working Group. N. Engl. J. Med. 2016;375:794–798. doi: 10.1056/NEJMsr1606602. - DOI - PMC - PubMed
    1. Reguero M., Gómez de Cedrón M., Wagner S., Reglero G., Quintela J.C., Ramírez de Molina A. Precision Nutrition to Activate Thermogenesis as a Complementary Approach to Target Obesity and Associated-Metabolic-Disorders. Cancers. 2021;13:866. doi: 10.3390/cancers13040866. - DOI - PMC - PubMed
    1. Smith L.A., O’Flanagan C.H., Bowers L.W., Allott E.H., Hursting S.D. Translating Mechanism-Based Strategies to Break the Obesity-Cancer Link: A Narrative Review. J. Acad. Nutr. Diet. 2018;118:652–667. doi: 10.1016/j.jand.2017.08.112. - DOI - PMC - PubMed

Publication types