. 2024 Jun 21;25(13):6820.
doi: 10.3390/ijms25136820.

Submandibular Gland Pathogenesis Following SARS-CoV-2 Infection and Implications for Xerostomia

Affiliations

Submandibular Gland Pathogenesis Following SARS-CoV-2 Infection and Implications for Xerostomia

Estela Sasso-Cerri et al. Int J Mol Sci. .

Abstract

Although SARS-CoV-2 induces mucin hypersecretion in the respiratory tract, hyposalivation/xerostomia has been reported by COVID-19 patients. We evaluate the submandibular gland (SMGs) pathogenesis in SARS-CoV-2-infected K18-hACE2 mice, focusing on the impact of infection on the mucin production and structural integrity of acini, ductal system, myoepithelial cells (MECs) and telocytes. The spike protein, the nucleocapsid protein, hACE2, actin, EGF, TNF-α and IL-1β were detected by immunofluorescence, and the Egfr and Muc5b expression was evaluated. In the infected animals, significant acinar hypertrophy was observed in contrast to ductal atrophy. Nucleocapsid proteins and/or viral particles were detected in the SMG cells, mainly in the nuclear membrane-derived vesicles, confirming the nuclear role in the viral formation. The acinar cells showed intense TNF-α and IL-1β immunoexpression, and the EGF-EGFR signaling increased, together with Muc5b upregulation. This finding explains mucin hypersecretion and acinar hypertrophy, which compress the ducts. Dying MECs and actin reduction were also observed, indicating failure of contraction and acinar support, favoring acinar hypertrophy. Viral assembly was found in the dying telocytes, pointing to these intercommunicating cells as viral transmitters in SMGs. Therefore, EGF-EGFR-induced mucin hypersecretion was triggered by SARS-CoV-2 in acinar cells, likely mediated by cytokines. The damage to telocytes and MECs may have favored the acinar hypertrophy, leading to ductal obstruction, explaining xerostomia in COVID-19 patients. Thus, acinar cells, telocytes and MECs may be viral targets, which favor replication and cell-to-cell viral transmission in the SMG, corroborating the high viral load in saliva of infected individuals.

Keywords: DMV; Sjögren’s syndrome; acinar cell; immunofluorescence; mucin; myoepithelial cell; salivary gland; sialadenosis; telocytes; transmission electron microscopy.


Conflict of interest statement

The authors declare no conflict of interest.

Figures

Figure 1
Figure 1
(AJ) Photomicrographs of submandibular gland sections subjected to immunofluorescence for detection of hACE2 (A,B), actin + spike double immunofluorescence (CF) and nucleocapsid protein (GJ). In (A,B), hACE2 is observed mainly in the acini (Ac) and some punctual immunoexpression in the GCTs (arrowheads). In (C), the GCTs are surrounded by discontinuous actin immunoexpression (green), and an evident spike immunolabeling is observed in the acinar cells (Ac). In (DF), co-localization of actin and spike (yellow) is noted in the myoepithelial cells (arrowheads) surrounding GCTs. In (G), nucleocapsid protein is observed in the acinar cells (Ac). In (HJ), nucleocapsid immunolabeling is observed filling the cytoplasm of acinar cells; note immunofluorescent reaction in close contact or within the nucleus (arrows).
Figure 2
Figure 2
(AF) Photomicrographs of SMGs showing immunofluorescence reactions for detection of TNF-α (AC) and IL-1 β (DF). In (A), a subtle TNF-α immunolabeling is observed in the acini (arrowheads) whereas in (B,C), a strong immunoreaction is observed in the acini (arrowheads) and basal portion of GCTs (arrows). In (D), the acinar IL-1β immunoreaction is weak (arrowheads) when compared to the strong acinar immunoreaction observed in E and F (arrowheads). Unspecific labelled erythrocytes are normally observed in the blood vessels (Bv).
Figure 3
Figure 3
(AF) Photomicrographs of submandibular gland sections stained by HE (A,B) and PAS method (CF). In (A,B), acini (Ac) and GCTs are observed. Note that in (B) (IG), the acinar area is increased and the GCTs diameter reduced (double headed arrows) when compared to CG. In (C,D), PAS-positive secretory granules (magenta) are observed in the GCTs; however, in IG, an intense PAS staining is filling almost all the cytoplasm in comparison to the normal apical staining pattern observed in CG. Note that most GCTs show a PAS-positive secretory content in the lumen (asterisks) in comparison to CG. Ac (acini). In (E,F), GCTs show PAS-positive granules in the apical portion ((E); asterisk) and filling almost all the cytoplasm ((F); asterisk). In (F) (IG), either the acinar (white arrows) or GCTs (black arrows) cells show irregular nuclei with strongly basophilic condensed chromatin in comparison to CG.
Figure 4
Figure 4
(A,B) Diameter and PAS-positive granular area in GCTs of animals from the CG and IG. (C) Volume density (Vv) of GCTs and acini in the animals from the CG and IG.
Figure 5
Figure 5
(A,B) Photomicrographs of SMGs showing immunofluorescence reactions for detection of EGF. In (A), an evident EGF immunoreaction is observed in the apical portion of GCTs whereas, in (B), a granular immunofluorescence is filling almost all the cytoplasm of tubular cells. (C) Immunofluorescent area of EGF in the SMGs of animals from the CG and IG. (D) Egfr mRNA levels in the SMG of animals from the CG and IG.
Figure 6
Figure 6
(AI) Photomicrographs of sections of SMGs stained by silver impregnation (AE) and AB (FI). In (A), acini (Ac) and GCTs are surrounded by evident basement membrane in black (arrows). In IG (BE), the basement membrane is discontinuous in some points where acinus (Ac) and GCT are interconnected (arrows), indicating fusion between these structures. In (F), AB-positive mucin is evident in the acini (Ac). The acinar–GCT interface is well delimited (arrowheads). In (G,H), the GCTs are compressed by the large AB-positive acini (Ac), and the AB-positive mucin seems to be invading the juxtaposed tubular cells (arrowheads). In (G,I), clusters of GCT cells (GCTc) are enclosed by the acinar cells (Ac). (J) A significant increase in Muc5b mRNA expression is observed in the IG in comparison to the CG.
Figure 7
Figure 7
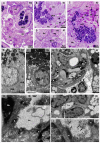
(AD) Photomicrographs of semithin sections of SMGs stained by toluidine blue. In (A), the normal acini show mucin granules (Ac) and GCT contains apical granules (white box). An intercalated duct is also observed with typical lumen (ID). In (B,C) (IG), the acinar cells are larger and filled with numerous mucin granules (Ac) in comparison to the CG. In GCTs, the granules are filling almost all the cytoplasm (white boxes). Narrow and compressed portions of GCT (stars) are continuous with intercalated ducts (ID), whose cells are compacted, showing flattened and irregular nuclei (arrows). Lumen (Lu). In (D), a GCT portion in close contact with acini (Ac) shows mucin granules, apparently inside GCT cells’ cytoplasm (white arrowheads); some of these cells are intermingled with the acinar cells (black arrowhead). (EJ) Electron micrographs of portions of GCTs and intercalated ducts (ID). In (E) (CG), the GCT cell shows rough endoplasmic reticulum (RER) and numerous homogeneous spherical secretory granules (asterisks) in the apical portion. In (F) (IG), a high granular density is noted in the cytoplasm; some granules show irregular shape (asterisks). The RER cisternae are larger and more electron-lucent than in the CG. Nu (nucleus). In (G) (similar to Figure 5C), a damaged and compressed GCT portion with typical granules is in contact with an intercalated duct (ID), whose cells show flattened nuclei (Nu) with electron-dense masses of chromatin (asterisks), indicating cell death. In the stroma, note two dying cells (C1 and C2) with the nuclei showing a peripheral condensed chromatin (asterisks) and irregular outline (black arrowheads). In (H) (high magnification of the intercalated duct in (G); white box), the apical portions of epithelial cells are attached by desmosomes (asterisks) and delimiting the lumen (Lu), in which viral particles (white arrows) are observed. The viral particles are surrounded by a membrane and contain nucleocapsid proteins (inset; white arrowheads). Nu (nucleus). In (I), intercalated duct cells (Nu) are delimiting the lumen (Lu). In (J) (high magnification of (I); black box), viral particles are seen in the lumen (black arrows). Some microvilli of the ductal cells containing actin filaments (arrowheads) are protruding towards the lumen. Desmosomes (asterisks) are also observed.
Figure 8
Figure 8
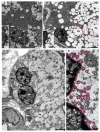
(AD) Electron micrographs of acini of submandibular gland sections of animals from the CG and IG. In (A), note the organized rough endoplasmic reticulum cisternae (RER) filling almost all the cytoplasm, and mucus granules (Mg) intermingled with the RER. The intact nuclear membrane is surrounded by typical circular RER cisternae (white arrows and inset). In (B), numerous mucus secretory granules (Mg) are filling almost all the cytoplasm; some of them are fusing with each other (asterisks), forming large mucus granules (pink circles). The remaining cytoplasm is filled with rough endoplasmic reticulum (RER) and mitochondria (Mi). Note that the nucleus (Nu), differently from the CG (A), shows an irregular nuclear membrane forming protrusions towards the cytoplasm (inset; black arrows). In (C), a binuclear acinar cell (Nu) shows dilated rough endoplasmic reticulum (RER) cisternae intermingling with large mucus secretory granules (Mg). Irregular masses of mucus secretion (asterisks), derived from the granules’ fusion, are spread through the cytoplasm. Portions of myoepithelial cells (MEC). In (D) (high magnification of delimited portion of (C)), RER cisternae-like structures (in pink) seem to be interconnected with a dilation of the nuclear intermembrane space (white asterisks). Nu (nucleus); Mi (mitochondria).
Figure 9
Figure 9
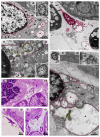
(A,B) Electron micrographs of portions of acinar cells of submandibular glands of animals from the IG. In (A), large vesicles (delimited by the pink line) are observed in the cytoplasm (pink asterisks). These vesicles are derived from dilations of the nuclear intermembrane space (black asterisks), forming irregular outlined vesicles (black arrows) continuous with the nuclear membrane. Some folded portions of these vesicles (named DMVs) are seen in cross sections within the dilation itself (black box and inset). Under high magnification (inset), a vesicle with double membrane (arrowhead) containing viral particles/nucleocapsid proteins (white arrows) is observed. Convoluted membranes (CMs) are also seen between the nuclear vesicles and the large cytoplasmic vesicles. In (B), a dilation of the nuclear intermembrane space (asterisks) forms a long vesicle (pink line) containing several DMVs (yellow lines) derived from the nuclear membrane folding itself, incorporating the cytoplasmic content with nucleocapsid proteins (white arrow), which are also observed inside DMVs (black arrows). Under high magnification (black box and inset), a DMV delimited by a double membrane (arrowheads) contains nucleocapsid proteins (black arrows). Mitochondria (Mi). Nu (nucleus). (CE), Photomicrographs of semithin sections of SMGs stained by toluidine blue. In (CE), telocytes with telopodes (arrowheads) are observed. In (D,E), the telocytes (arrows) show an atypical nucleus in comparison to (C). In (E), a vacuolar structure is observed in a telocyte cytoplasm (asterisk). (F,G) Electron micrographs of portions of SMGs of animals from the IG. In (F), a digitally colored electron micrograph shows portions of telocytes (pink) in the stroma. Note the moniliform aspect of the telopodes with an alternation between the podomers (white arrowheads) and the podoms (black arrows). Several vacuole-type vesicles are observed in the cytoplasm (asterisks). Bv (blood vessel); Ac (acini); GCT (granular convoluted tubule). In (G) (high magnification of (F)), a dilation of the nuclear intermembrane space (white asterisks) forming large vesicles (pink line and pink asterisks). In the nuclear vesicle, a DMV (black box) containing viral particles (left inset; black arrows) is observed. Note convoluted membranes (CMs) between the nucleus and the large vesicles. Nucleocapsid proteins (white arrows) are observed in viral assembly portions (yellow lines). A folded vesicle portion (delimited by the yellow line) inside the vesicle itself is observed. A vesicle containing viral particles (around 150 nm) is observed in the cell periphery (right inset; black arrows); in some of them, spike proteins (black arrowheads) can be seen. Note a centriole (white arrowhead) in the telocyte cytoplasm. Nu (nucleus).
Figure 10
Figure 10
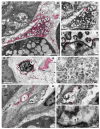
(AH) Digitally colored electron micrographs of portions of stroma of SMGs of animals from the IG. In (A), a telocyte (pink) localized in the stroma between GCT and acinus (Ac). The telocyte shows a dichotomous pattern of branching (black arrowhead) and a moniliform aspect of the telopodes, with an alternation between the podomers (white arrowheads) and the podoms (black arrows). Note the large cytoplasmic portion containing convoluted vesicles (black asterisks). Mitochondria (Mi). In (B), a high magnification of (A), the convoluted large DMVs (asterisks) containing small, folded portions of the vesicles themselves (white arrows). Note the folded membrane during invagination (red arrow) and the formed vesicle after invagination (red arrowhead). In a large fold (black box and inset), note several viral particles, probably nucleocapsid proteins (white arrows). In (C) (high magnification of (B)—white box), several viral particles (nucleocapsid proteins) are seen outside the vesicle (arrowheads) and within the formed vesicles after invagination (white arrows). Note regions of the invagination process (pink circles). In (D), a dying telocyte with condensed clumps of chromatin in the nucleus (white asterisks) shows dilations of the nuclear intermembrane space (black asterisks). Mitochondria (Mi). In the cytoplasmic portion of the telocyte (black boxes), several viral particles are seen. In (E) (high magnifications of (D)—black boxes), note viral particles with spike proteins (arrowheads). In (F), a stroma portion between acinus (Ac) and GCT shows a collapsed blood vessel with a narrow lumen (Lu), surrounded by basal lamina (asterisks). Note DMVs (white arrows) with viral particles (black arrow) in the endotheliocyte. A DMV (white arrow) is also observed in a telopode (Tp) of a telocyte (in pink). Endotheliocyte nucleus (Nu). In (G,H) (high magnifications of DMV), viral particles (black arrows) and viral assembly sites containing nucleocapsid proteins (pink circles) are seen. In H, spike proteins are observed either on the viral surface (white arrowheads) or on the vesicle inner surface (black arrowheads).
Figure 11
Figure 11
(AD) Electron micrographs of the SMGs of animals from the IG showing portions of damaged MECs. In (A,B), dying MECs in close contact with acinus (Ac; (A)) and GCT (B) show electron dense masses of chromatin (asterisks) in the nucleus (Nu), and cytoplasm filled with actin filaments (Af). In (B), note the nuclear intermembrane space dilation (delimited by pink lines) and cytoplasmic vesicle (pink line and pink asterisk) derived from the nuclear dilation. Mucus granules (Mg); mitochondria (Mi). In (C), a portion of a damaged MEC shows cytoplasm filled with actin filaments (Af) and double membrane vesicles (white box and inset; white arrowheads). Several viral particles measuring around 130 nm are observed inside DMVs (inset; white arrows). In (D), a damaged MEC shows condensed chromatin (asterisks) in the nucleus (Nu). Note the DMVs (pink line and pink asterisks) derived from the nuclear intermembrane space dilation (pink line and white arrows). Double membrane of DMV is seen under high magnification (inset). Viral particles are observed either in groups, enclosed in large vesicles (black arrows), or isolated within small vesicles (black box and inset; white arrowheads) among actin filaments (Af), next to the plasma membrane. (EH) Photomicrographs of SMGs showing actin immunofluorescence in MECs. In (E,G), strong and continuous actin immunolabelling (green; arrows) is observed in the MECs surrounding the acini and GCTs. In (F,H), a weak and discontinuous actin immunoreaction surrounding GCTs and acini (green; arrows) is observed in IG. In (I), a significant decrease in the actin immunofluorescent area is observed in IG in comparison with CG.
Figure 12
Figure 12
Schematic representation of the SMG pathogenesis following SARS-CoV-2 infection. In normal SMGs, the acini and GCT, showing normal distribution of the secretory granules, release their secretory content in the intercalated (ID) and striated (SD)/excretory ducts (ED), respectively, and transport saliva to the oral cavity. Myoepithelial cells (MECs) surround acini, GCT and ducts. In the stroma, telocytes interconnect blood vessels (BV), acini, ducts and GCT. In the infected SMG, (1) SARS-CoV-2 from the blood stream reaches telocytes and MECs. In these branched and supportive cells, the virus is replicated and transmitted to other cell types, allowing a rapid viral transmission, mainly to acinar cells. (2) In these cells, the infection induces mucin hypersecretion and accumulation of granules in the cytoplasm, culminating in the acinar hypertrophy. (3) The acinar enlargement causes ID and GCT compression, impairing the transport of saliva to the oral cavity. The loss of acinar structural support, due to telocytes and MECs death, favors the acinar enlargement caused by mucin hypersecretion. (4) SARS-CoV-2 infection triggers pro-inflammatory cytokines production (IL-1β and TNF-α), which activate EGF-EGFR signaling, causing Muc5b upregulation, culminating in the mucin hypersecretion and accumulation.

Similar articles

Cited by

References

    1. Zhang R., Li Y., Zhang A.L., Wang Y., Molina M.J. Identifying airborne transmission as the dominant route for the spread of COVID-19. Proc. Natl. Acad. Sci. USA. 2020;117:25942–25943. - PMC - PubMed
    1. Han P., Ivanovski S. Saliva-friend and foe in the COVID-19 Outbreak. Diagnostics. 2020;10:290. doi: 10.3390/diagnostics10050290. - DOI - PMC - PubMed
    1. Matuck B.F., Dolhnikoff M., Duarte-Neto A.N., Maia G., Gomes S.C., Sendyk D.I., Zarpellon A., de Andrade N.P., Monteiro R.A., Pinho J.R.R., et al. Salivary glands are a target for SARS-CoV-2: A source for saliva contamination. J. Pathol. 2021;254:239–243. doi: 10.1002/path.5679. - DOI - PMC - PubMed
    1. Huang N., Pérez P., Kato T., Mikami Y., Okuda K., Gilmore R.C., Conde C.D., Gasmi B., Stein S., Beach M., et al. SARS-CoV-2 infection of the oral cavity and saliva. Nat. Med. 2021;27:892–903. doi: 10.1038/s41591-021-01296-8. - DOI - PMC - PubMed
    1. Wang C., Wu H., Ding X., Ji H., Jiao P., Song H., Li S., Du H. Does infection of 2019 novel coronavirus cause acute and/or chronic sialadenitis? Med. Hypotheses. 2020;140:109789. doi: 10.1016/j.mehy.2020.109789. - DOI - PMC - PubMed

MeSH terms