

STAT5 Is Necessary for the Metabolic Switch Induced by IL-2 in Cervical Cancer Cell Line SiHa
- PMID: 38999946
- PMCID: PMC11241652
- DOI: 10.3390/ijms25136835
STAT5 Is Necessary for the Metabolic Switch Induced by IL-2 in Cervical Cancer Cell Line SiHa
Abstract
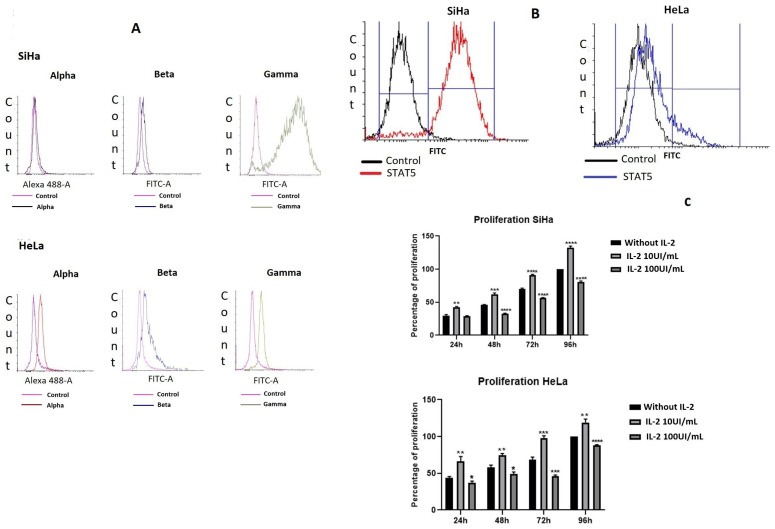
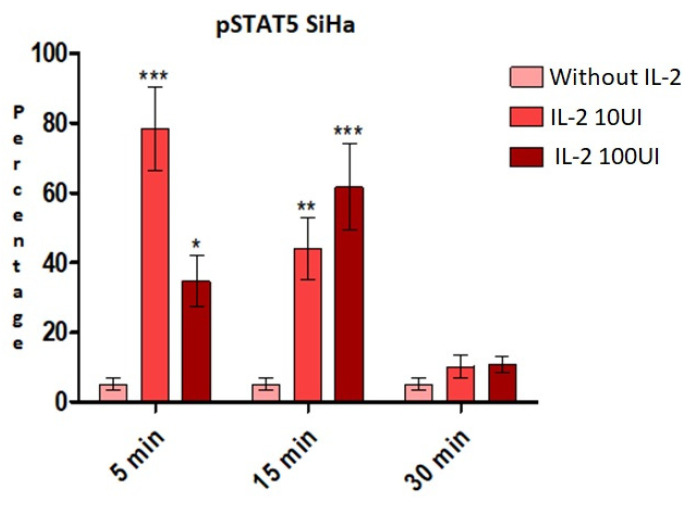
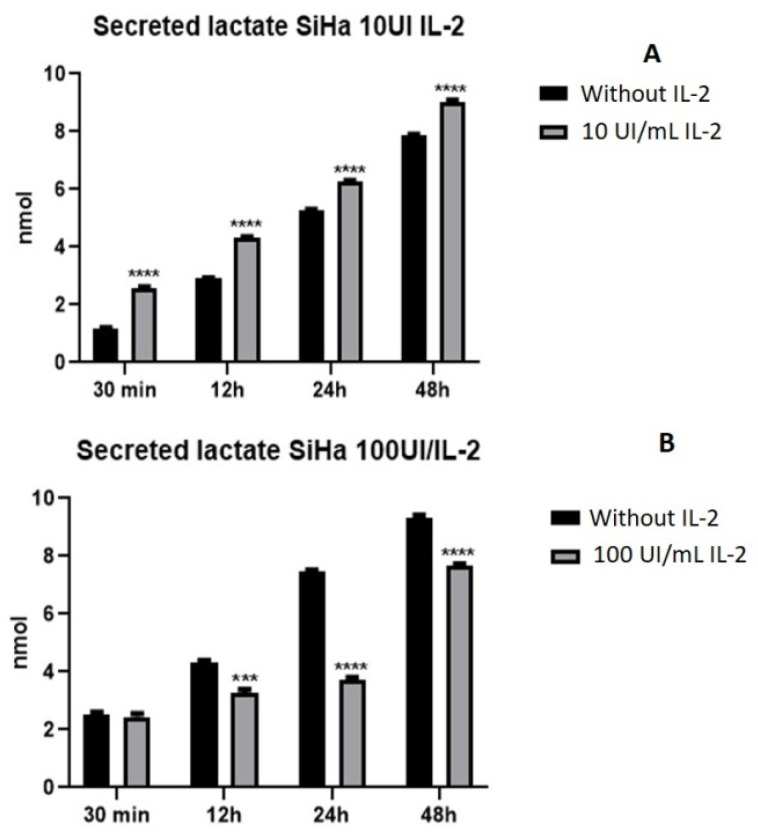
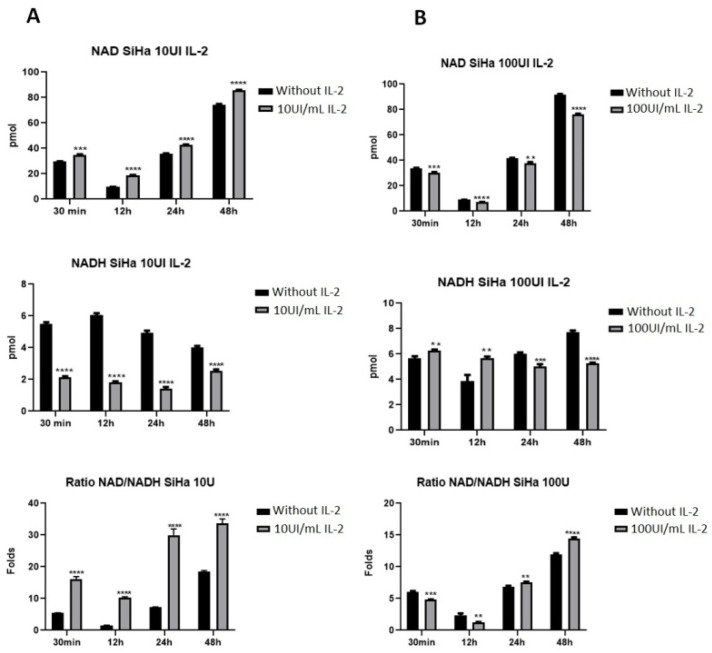
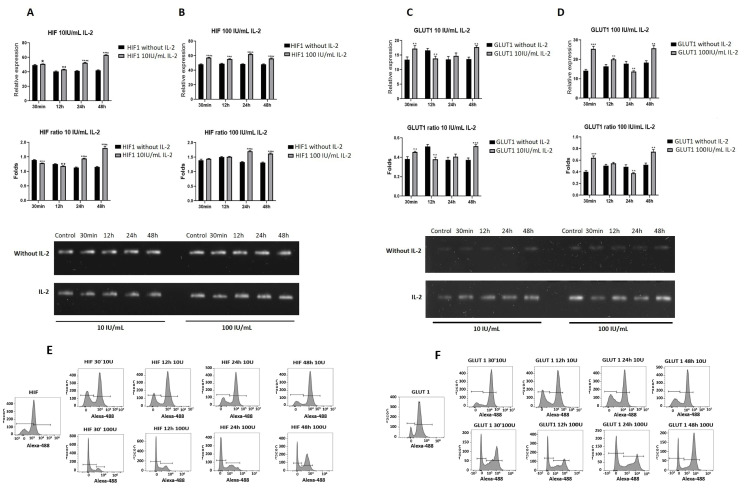
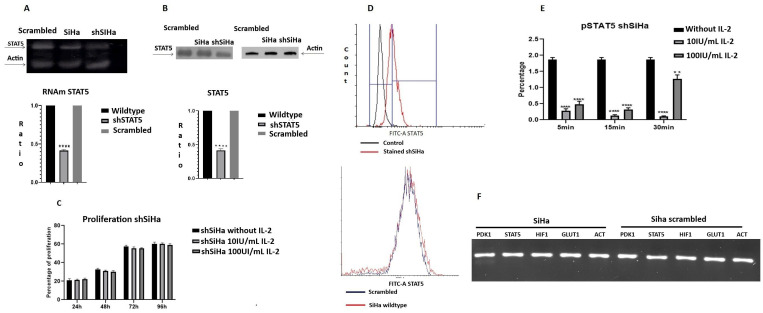
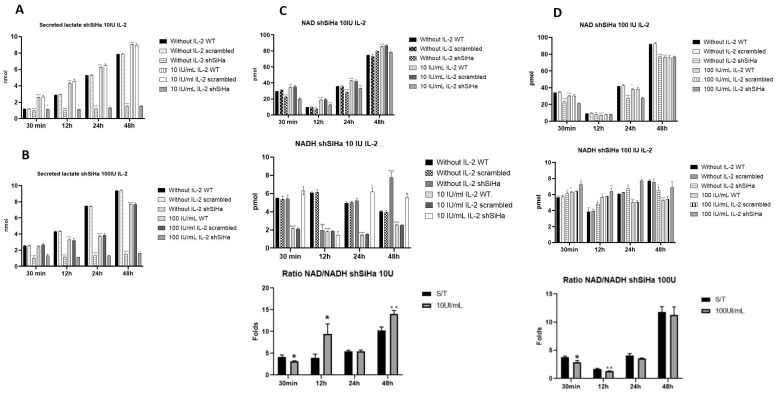
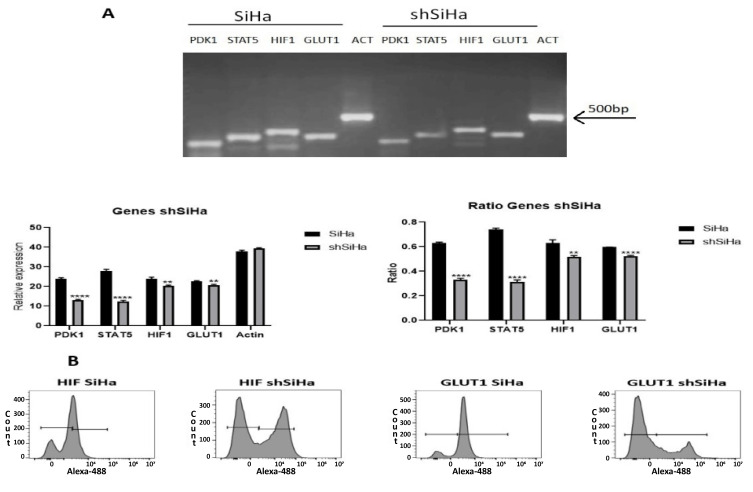
The tumor cells reprogram their metabolism to cover their high bioenergetic demands for maintaining uncontrolled growth. This response can be mediated by cytokines such as IL-2, which binds to its receptor and activates the JAK/STAT pathway. Some reports show a correlation between the JAK/STAT pathway and cellular metabolism, since the constitutive activation of STAT proteins promotes glycolysis through the transcriptional activation of genes related to energetic metabolism. However, the role of STAT proteins in the metabolic switch induced by cytokines in cervical cancer remains poorly understood. In this study, we analyzed the effect of IL-2 on the metabolic switch and the role of STAT5 in this response. Our results show that IL-2 induces cervical cancer cell proliferation and the tyrosine phosphorylation of STAT5. Also, it induces an increase in lactate secretion and the ratio of NAD+/NADH, which suggest a metabolic reprogramming of their metabolism. When STAT5 was silenced, the lactate secretion and the NAD+/NADH ratio decreased. Also, the expression of HIF1α and GLUT1 decreased. These results indicate that STAT5 regulates IL-2-induced cell proliferation and the metabolic shift to aerobic glycolysis by regulating genes related to energy metabolism. Our results suggest that STAT proteins modulate the metabolic switch in cervical cancer cells to attend to their high demand of energy required for cell growth and proliferation.
Keywords: IL-2; NAD+/NADH ratio; STAT5; cervical cancer; lactate; metabolic switch.
Conflict of interest statement
The authors declare no conflicts of interest.
Figures
Similar articles
-
TNFα and IL-17 cooperatively stimulate glucose metabolism and growth factor production in human colorectal cancer cells.Mol Cancer. 2013 Jul 17;12:78. doi: 10.1186/1476-4598-12-78. Mol Cancer. 2013. PMID: 23866118 Free PMC article.
-
Caffeic Acid Targets AMPK Signaling and Regulates Tricarboxylic Acid Cycle Anaplerosis while Metformin Downregulates HIF-1α-Induced Glycolytic Enzymes in Human Cervical Squamous Cell Carcinoma Lines.Nutrients. 2018 Jun 28;10(7):841. doi: 10.3390/nu10070841. Nutrients. 2018. PMID: 29958416 Free PMC article.
-
Lactate secreted by cervical cancer cells modulates macrophage phenotype.J Leukoc Biol. 2019 May;105(5):1041-1054. doi: 10.1002/JLB.3A0718-274RR. Epub 2019 Feb 27. J Leukoc Biol. 2019. PMID: 30811636
-
How does hypoxia inducible factor-1α participate in enhancing the glycolysis activity in cervical cancer?Ann Diagn Pathol. 2013 Jun;17(3):305-11. doi: 10.1016/j.anndiagpath.2012.12.002. Epub 2013 Feb 1. Ann Diagn Pathol. 2013. PMID: 23375385 Review.
-
Metabolic phenotype of bladder cancer.Cancer Treat Rev. 2016 Apr;45:46-57. doi: 10.1016/j.ctrv.2016.03.005. Epub 2016 Mar 8. Cancer Treat Rev. 2016. PMID: 26975021 Review.
Cited by
-
Interleukins in the Pathogenesis of Warts: Insight from the Last Decade-A Narrative Review.J Clin Med. 2025 Mar 18;14(6):2057. doi: 10.3390/jcm14062057. J Clin Med. 2025. PMID: 40142865 Free PMC article. Review.
-
The Multifaceted Role of the IL-2 Cytokine Family in Melanoma: Mechanisms, Therapeutic Implications, and Immune Modulation.J Immunol Res. 2025 Jul 2;2025:8890939. doi: 10.1155/jimr/8890939. eCollection 2025. J Immunol Res. 2025. PMID: 40636453 Free PMC article. Review.
References
-
- Warburg O., Posener K., Negelein E. Über den Stoffwechsel der Tumoren. Biochem. Z. 1924;152:319–344.
MeSH terms
Substances
Grants and funding
LinkOut - more resources
Full Text Sources
Medical
Miscellaneous
