

Comprehensive Analysis of the Function and Prognostic Value of TAS2Rs Family-Related Genes in Colon Cancer
- PMID: 38999959
- PMCID: PMC11241446
- DOI: 10.3390/ijms25136849
Comprehensive Analysis of the Function and Prognostic Value of TAS2Rs Family-Related Genes in Colon Cancer
Abstract
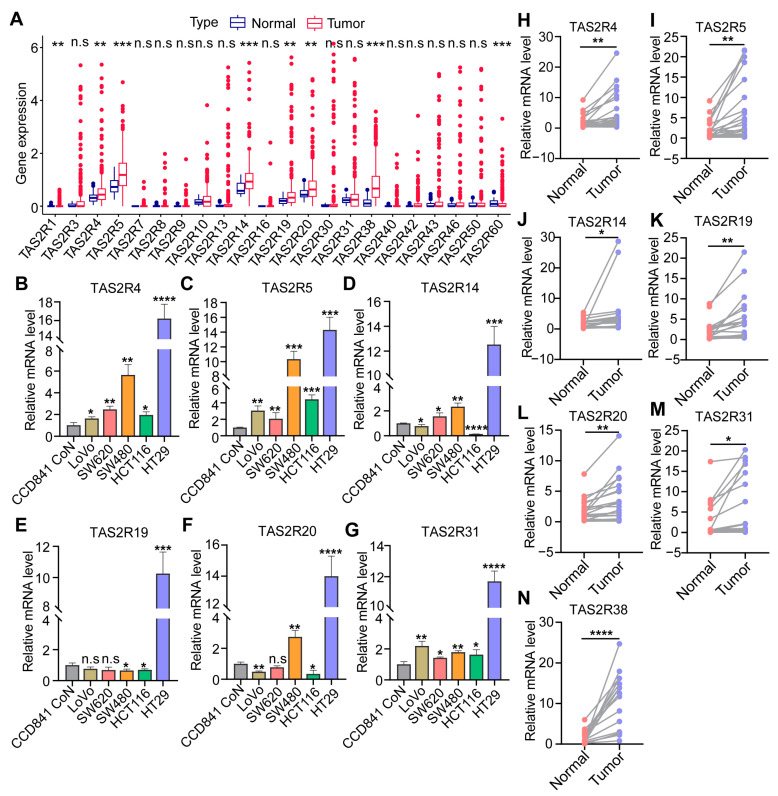
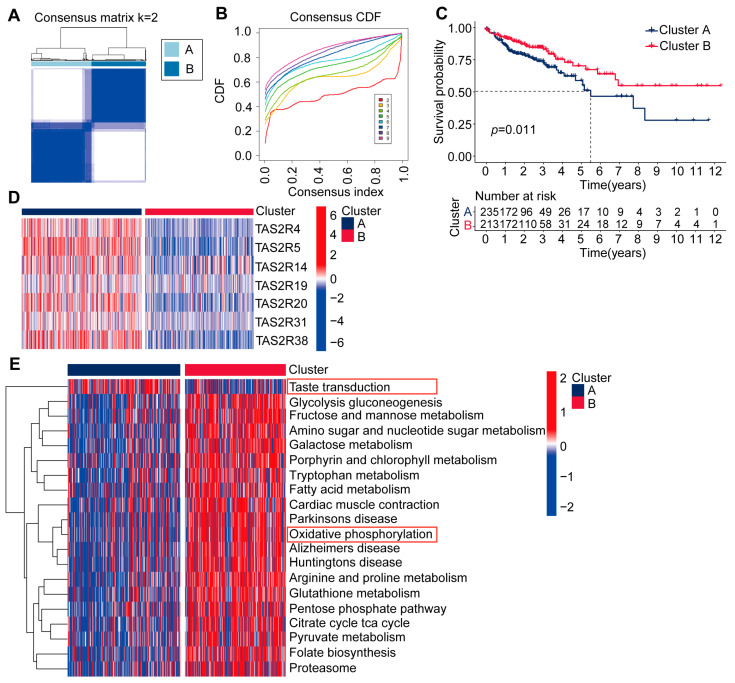
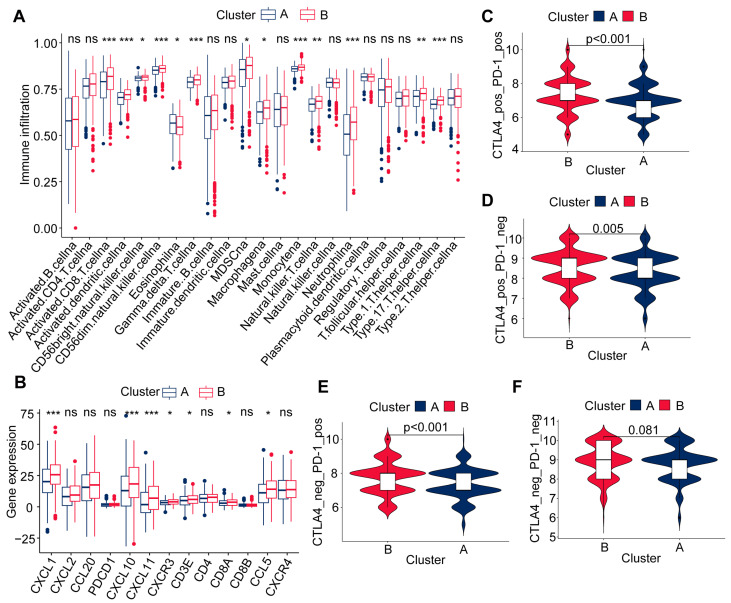
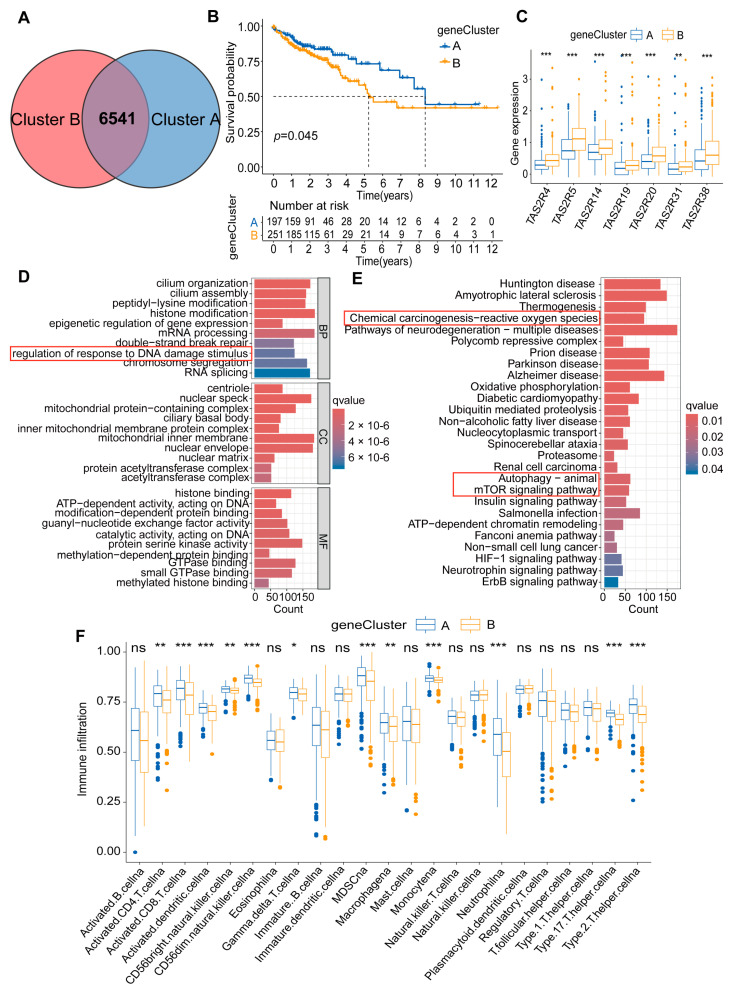
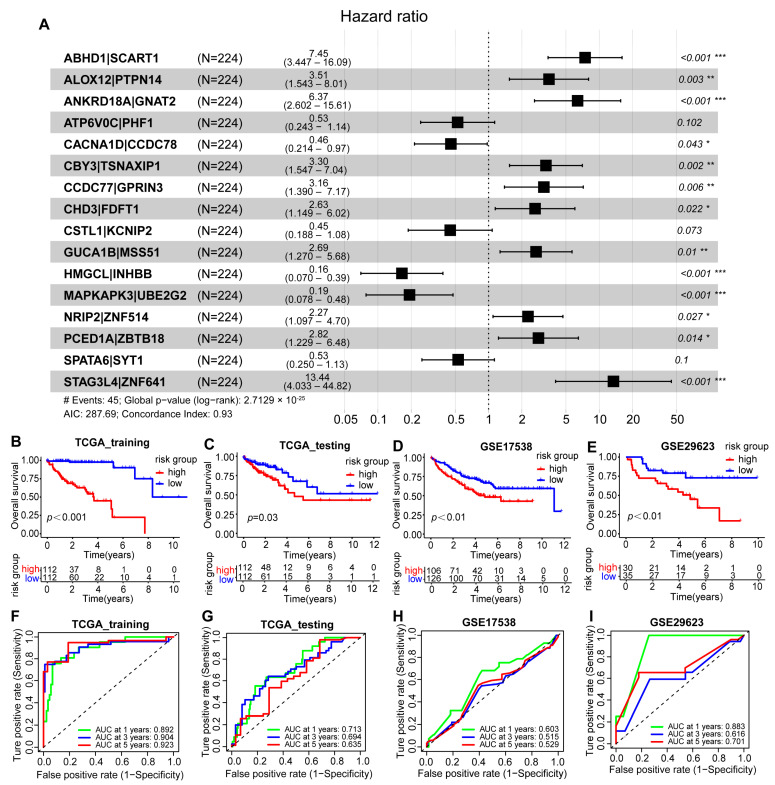
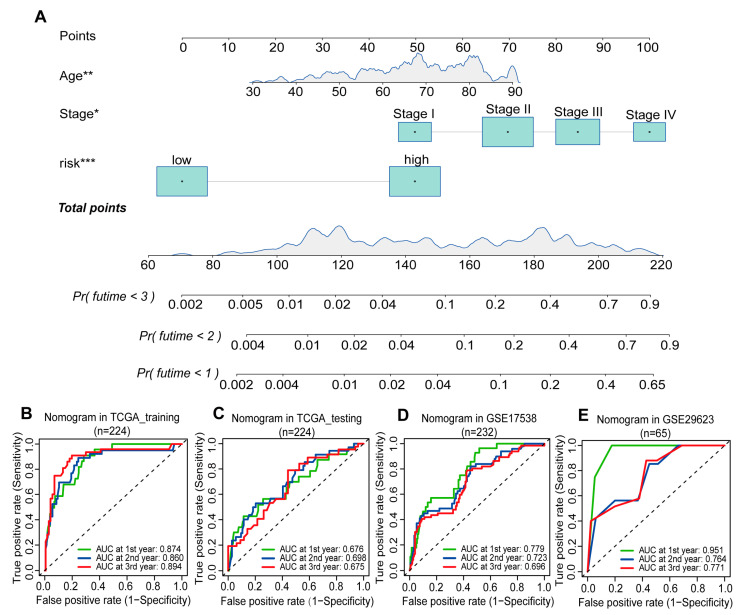
In the realm of colon carcinoma, significant genetic and epigenetic diversity is observed, underscoring the necessity for tailored prognostic features that can guide personalized therapeutic strategies. In this study, we explored the association between the type 2 bitter taste receptor (TAS2Rs) family-related genes and colon cancer using RNA-sequencing and clinical datasets from The Cancer Genome Atlas (TCGA) and the Gene Expression Omnibus (GEO). Our preliminary analysis identified seven TAS2Rs genes associated with survival using univariate Cox regression analysis, all of which were observed to be overexpressed in colon cancer. Subsequently, based on these seven TAS2Rs prognostic genes, two colon cancer molecular subtypes (Cluster A and Cluster B) were defined. These subtypes exhibited distinct prognostic and immune characteristics, with Cluster A characterized by low immune cell infiltration and less favorable outcomes, while Cluster B was associated with high immune cell infiltration and better prognosis. Finally, we developed a robust scoring system using a gradient boosting machine (GBM) approach, integrated with the gene-pairing method, to predict the prognosis of colon cancer patients. This machine learning model could improve our predictive accuracy for colon cancer outcomes, underscoring its value in the precision oncology framework.
Keywords: colon cancer; immunotherapy; machine learning; type 2 bitter taste receptor.
Conflict of interest statement
The authors declare that they have no known competing financial interests or personal relationships that could appear to influence the work reported in this paper.
Figures
Similar articles
-
Identification of Molecular Subtypes and a Prognostic Signature Based on Inflammation-Related Genes in Colon Adenocarcinoma.Front Immunol. 2021 Dec 23;12:769685. doi: 10.3389/fimmu.2021.769685. eCollection 2021. Front Immunol. 2021. PMID: 35003085 Free PMC article.
-
INHBA is a prognostic predictor for patients with colon adenocarcinoma.BMC Cancer. 2020 Apr 15;20(1):305. doi: 10.1186/s12885-020-06743-2. BMC Cancer. 2020. PMID: 32293338 Free PMC article.
-
Identification and validation of the prognostic signature of a novel demethylation-related gene associated with the clinical features of colon cancer.Int Immunopharmacol. 2024 Sep 30;139:112798. doi: 10.1016/j.intimp.2024.112798. Epub 2024 Jul 29. Int Immunopharmacol. 2024. PMID: 39079198
-
Construction of Immune Infiltration-Related LncRNA Signatures Based on Machine Learning for the Prognosis in Colon Cancer.Biochem Genet. 2024 Jun;62(3):1925-1952. doi: 10.1007/s10528-023-10516-4. Epub 2023 Oct 4. Biochem Genet. 2024. PMID: 37792224
-
Constructing and validating a risk model based on neutrophil-related genes for evaluating prognosis and guiding immunotherapy in colon cancer.J Gene Med. 2024 Apr;26(4):e3684. doi: 10.1002/jgm.3684. J Gene Med. 2024. PMID: 38618694 Review.
Cited by
-
Artificial intelligence networks for assessing the prognosis of gastrointestinal cancer to immunotherapy based on genetic mutation features: a systematic review and meta-analysis.BMC Gastroenterol. 2025 Apr 29;25(1):310. doi: 10.1186/s12876-025-03884-1. BMC Gastroenterol. 2025. PMID: 40301768 Free PMC article.
References
-
- Cheng E., Ou F.S., Ma C., Spiegelman D., Zhang S., Zhou X., Bainter T.M., Saltz L.B., Niedzwiecki D., Mayer R.J., et al. Diet- and Lifestyle-Based Prediction Models to Estimate Cancer Recurrence and Death in Patients with Stage III Colon Cancer (CALGB 89803/Alliance) J. Clin. Oncol. 2022;40:740–751. doi: 10.1200/JCO.21.01784. - DOI - PMC - PubMed
Publication types
MeSH terms
Substances
Grants and funding
LinkOut - more resources
Full Text Sources
