

Identification of miRNAs and Their Target Genes Associated with Sunitinib Resistance in Clear Cell Renal Cell Carcinoma Patients
- PMID: 38999991
- PMCID: PMC11241516
- DOI: 10.3390/ijms25136881
Identification of miRNAs and Their Target Genes Associated with Sunitinib Resistance in Clear Cell Renal Cell Carcinoma Patients
Abstract
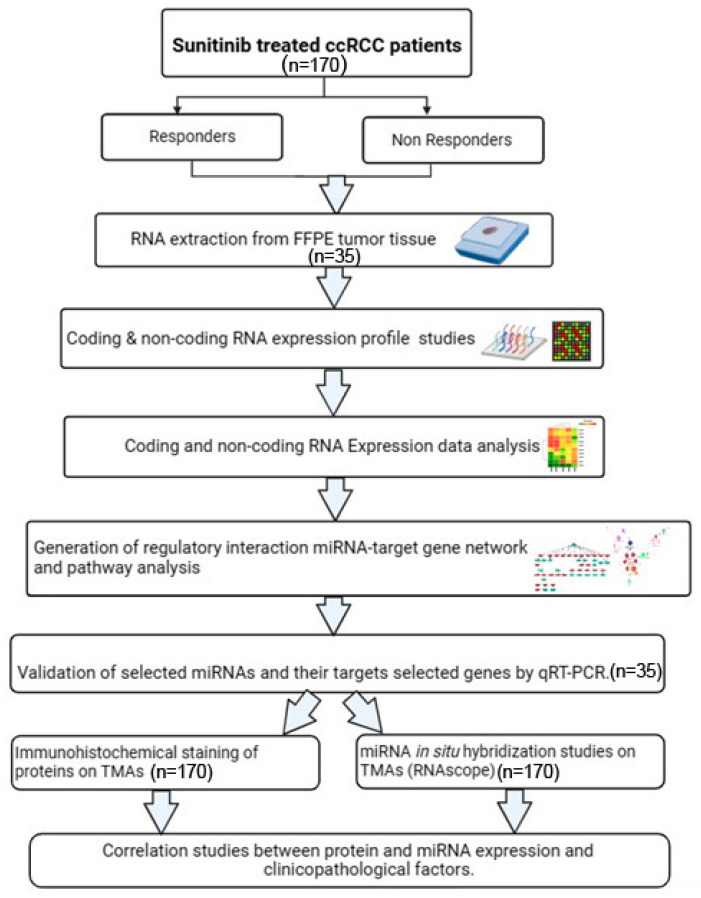
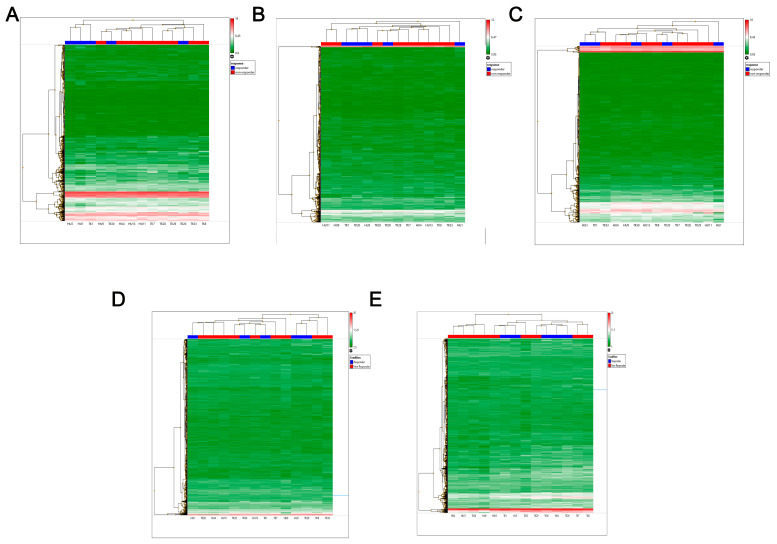
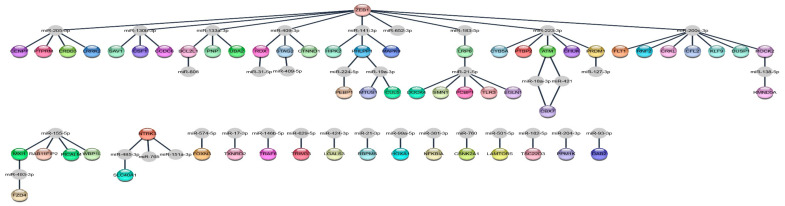
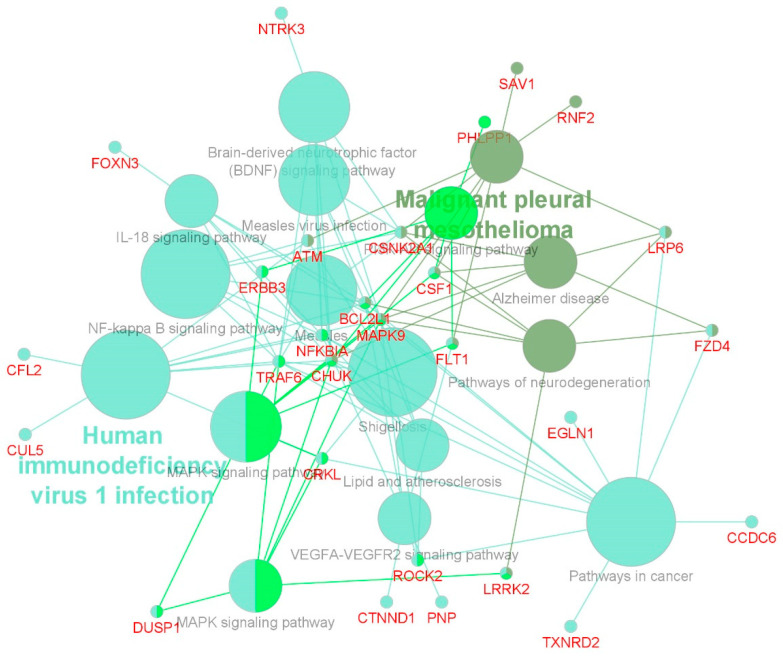
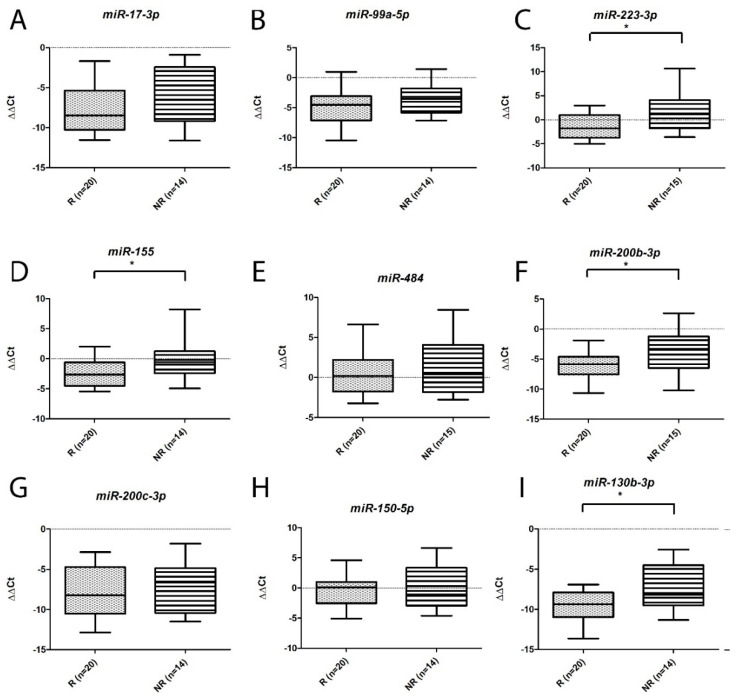
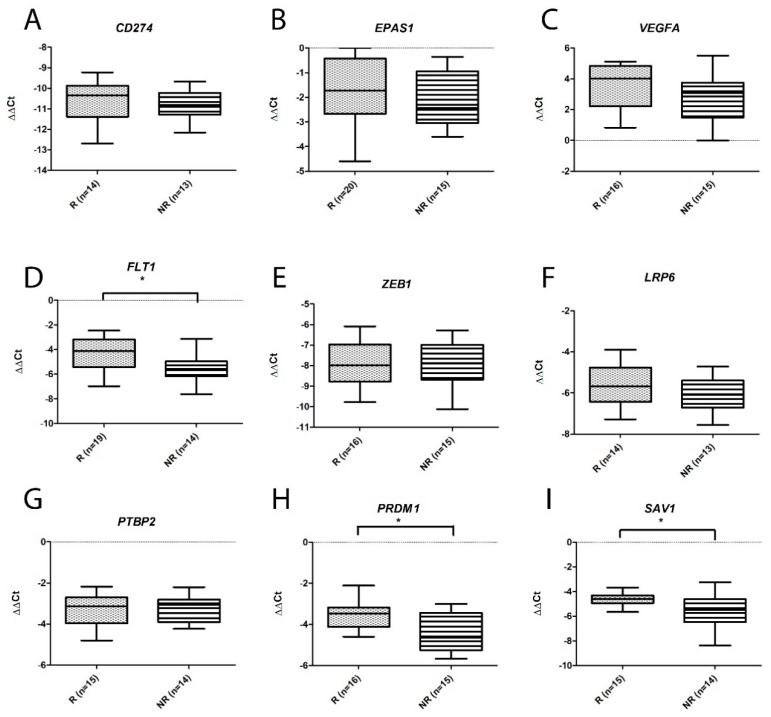
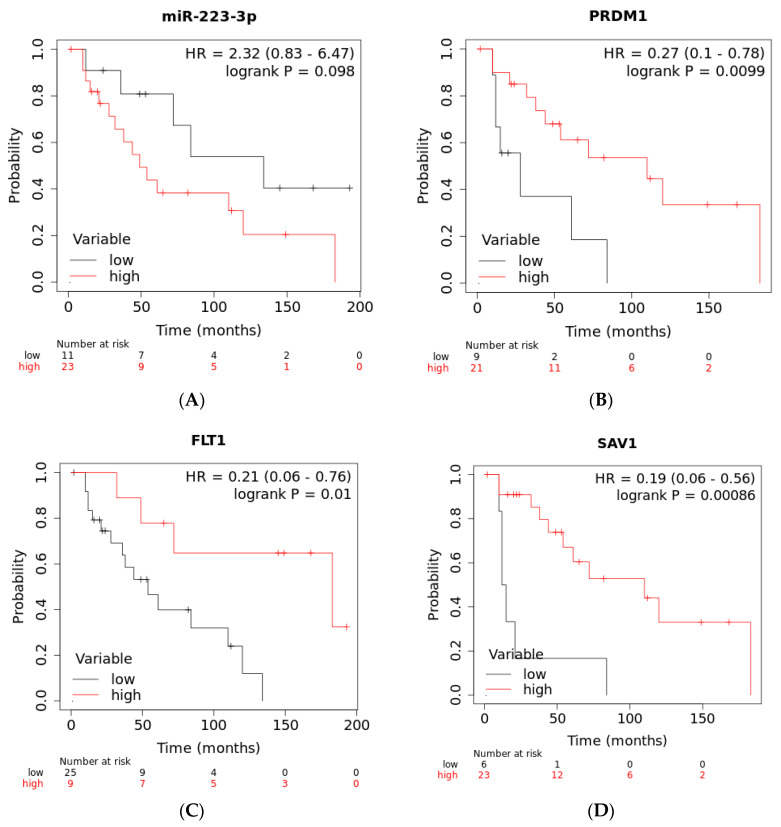
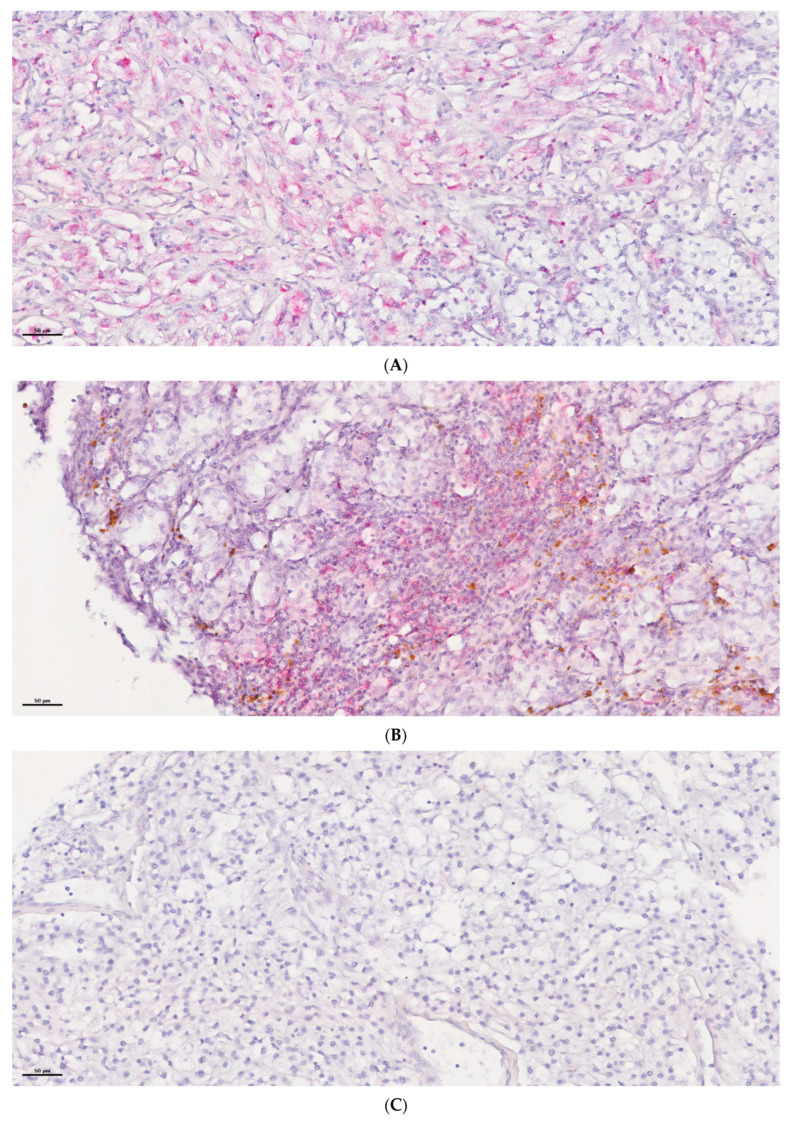
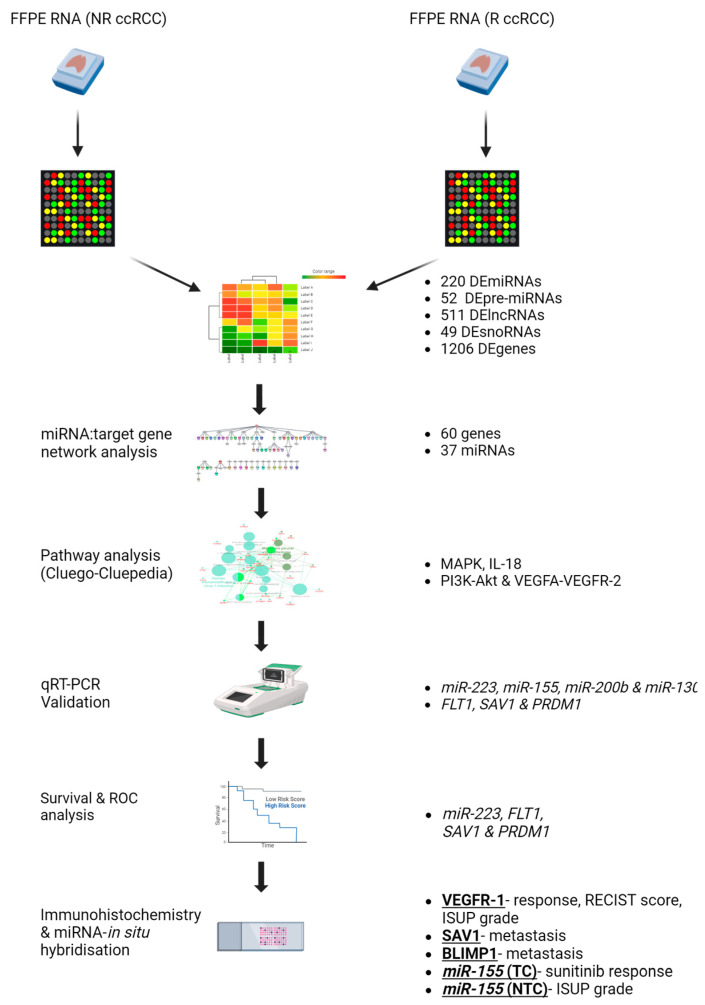
Sunitinib has greatly improved the survival of clear cell renal cell carcinoma (ccRCC) patients in recent years. However, 20-30% of treated patients do not respond. To identify miRNAs and genes associated with a response, comparisons were made between biopsies from responder and non-responder ccRCC patients. Using integrated transcriptomic analyses, we identified 37 miRNAs and 60 respective target genes, which were significantly associated with the NF-kappa B, PI3K-Akt and MAPK pathways. We validated expression of the miRNAs (miR-223, miR-155, miR-200b, miR-130b) and target genes (FLT1, PRDM1 and SAV1) in 35 ccRCC patients. High levels of miR-223 and low levels of FLT1, SAV1 and PRDM1 were associated with worse overall survival (OS), and combined miR-223 + SAV1 levels distinguished responders from non-responders (AUC = 0.92). Using immunohistochemical staining of 170 ccRCC patients, VEGFR1 (FLT1) expression was associated with treatment response, histological grade and RECIST (Response Evaluation Criteria in Solid Tumors) score, whereas SAV1 and BLIMP1 (PRDM1) were associated with metachronous metastatic disease. Using in situ hybridisation (ISH) to detect miR-155 we observed higher tumoural cell expression in non-responders, and non-tumoural cell expression with increased histological grade. In summary, our preliminary analysis using integrated miRNA-target gene analyses identified several novel biomarkers in ccRCC patients that surely warrant further investigation.
Keywords: miRNA; pathway analysis; renal cancer; resistance; sunitinib; transcriptome.
Conflict of interest statement
The authors declare no conflicts of interest.
Figures
Similar articles
-
Expressions of miR-96-5p, miR-29b-3p, and Their Target Gene THBS1 in Clear Cell Renal Cell Carcinoma and Sunitinib Resistance.Altern Ther Health Med. 2024 Jul;30(7):268-273. Altern Ther Health Med. 2024. PMID: 37971460
-
Identification of tissue microRNAs predictive of sunitinib activity in patients with metastatic renal cell carcinoma.PLoS One. 2014 Jan 24;9(1):e86263. doi: 10.1371/journal.pone.0086263. eCollection 2014. PLoS One. 2014. PMID: 24475095 Free PMC article.
-
PDZK1 confers sensitivity to sunitinib in clear cell renal cell carcinoma by suppressing the PDGFR-β pathway.Br J Cancer. 2024 Jul;131(2):347-360. doi: 10.1038/s41416-024-02725-4. Epub 2024 May 31. Br J Cancer. 2024. PMID: 38822145 Free PMC article.
-
Circular RNA circAGAP1 promotes sunitinib sensitivity in renal cell carcinoma via sponging multiple PDGFR-targeted miRNAs.Oncol Res. 2025 Jan 16;33(2):407-420. doi: 10.32604/or.2024.047698. eCollection 2025. Oncol Res. 2025. PMID: 39866227 Free PMC article.
-
Candidate MicroRNA Biomarkers of Therapeutic Response to Sunitinib in Metastatic Renal Cell Carcinoma: A Validation Study in Patients with Extremely Good and Poor Response.Anticancer Res. 2018 May;38(5):2961-2965. doi: 10.21873/anticanres.12546. Anticancer Res. 2018. PMID: 29715124
Cited by
-
Prognostic and Therapeutic Implications of Alamandine Receptor MrgD Expression in Clear Cell Renal Cell Carcinoma with Development of Metastatic Disease.Biomolecules. 2025 Mar 7;15(3):387. doi: 10.3390/biom15030387. Biomolecules. 2025. PMID: 40149923 Free PMC article.
-
Trends and hotspots in targeted therapy resistance research for renal cell carcinoma: a bibliometric and visualization analysis.Discov Oncol. 2025 Jun 11;16(1):1055. doi: 10.1007/s12672-025-02772-0. Discov Oncol. 2025. PMID: 40498158 Free PMC article.
-
Use of Gain-of-Function Screening to Identify miRNAs Involved in Paclitaxel Resistance in Triple-Negative Breast Cancer.Int J Mol Sci. 2024 Dec 20;25(24):13630. doi: 10.3390/ijms252413630. Int J Mol Sci. 2024. PMID: 39769392 Free PMC article.
References
-
- Dudani S., de Velasco G., Wells J.C., Gan C.L., Donskov F., Porta C., Fraccon A., Pasini F., Lee J.L., Hansen A., et al. Evaluation of Clear Cell, Papillary, and Chromophobe Renal Cell Carcinoma Metastasis Sites and Association With Survival. JAMA Netw. Open. 2021;4:e2021869. doi: 10.1001/jamanetworkopen.2020.21869. - DOI - PMC - PubMed
MeSH terms
Substances
Grants and funding
LinkOut - more resources
Full Text Sources
Medical
