

A Genome-Wide Analysis of the Jasmonic Acid Biosynthesis Gene Families in Peanut Reveals Their Crucial Roles in Growth and Abiotic Stresses
- PMID: 39000161
- PMCID: PMC11241683
- DOI: 10.3390/ijms25137054
A Genome-Wide Analysis of the Jasmonic Acid Biosynthesis Gene Families in Peanut Reveals Their Crucial Roles in Growth and Abiotic Stresses
Abstract
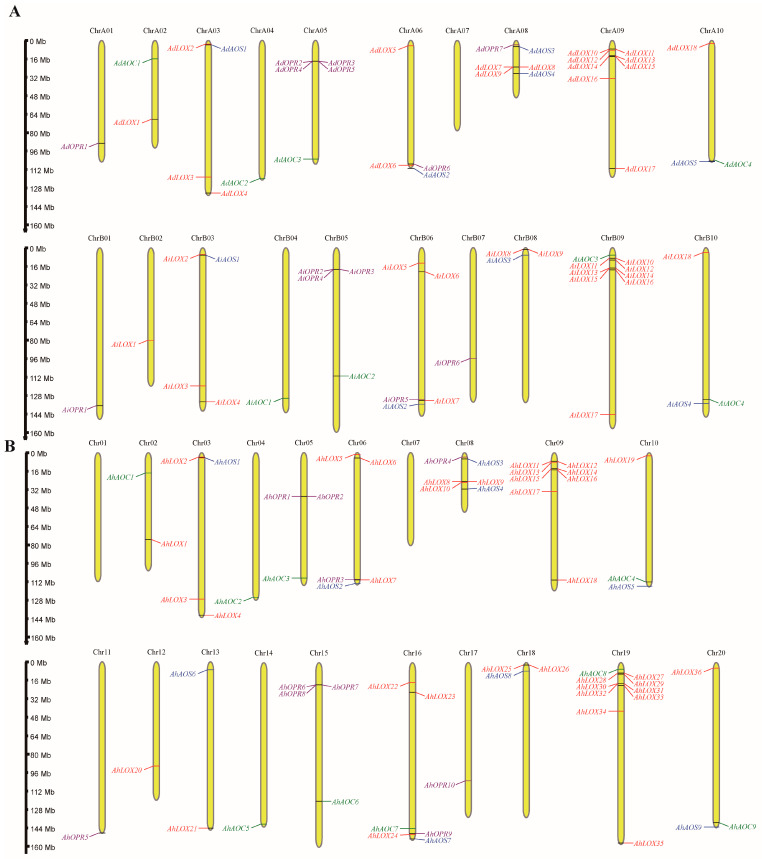
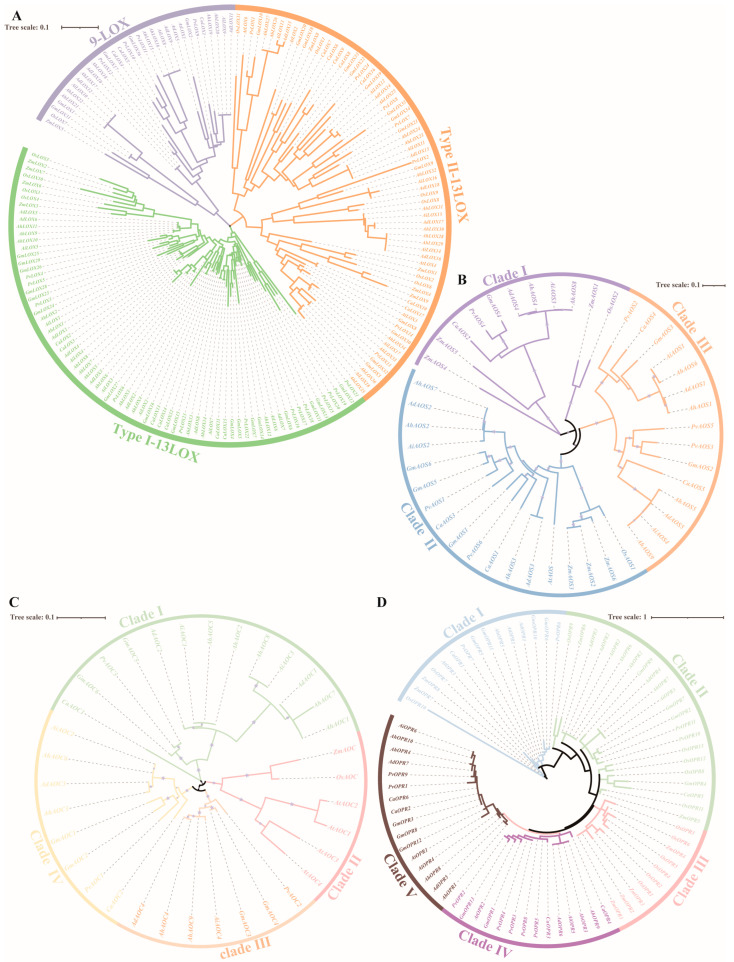
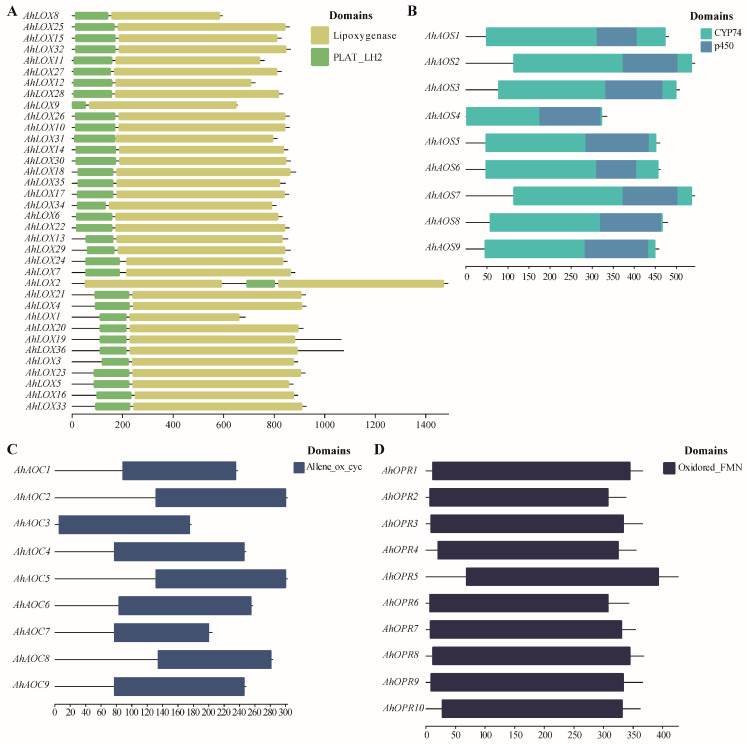
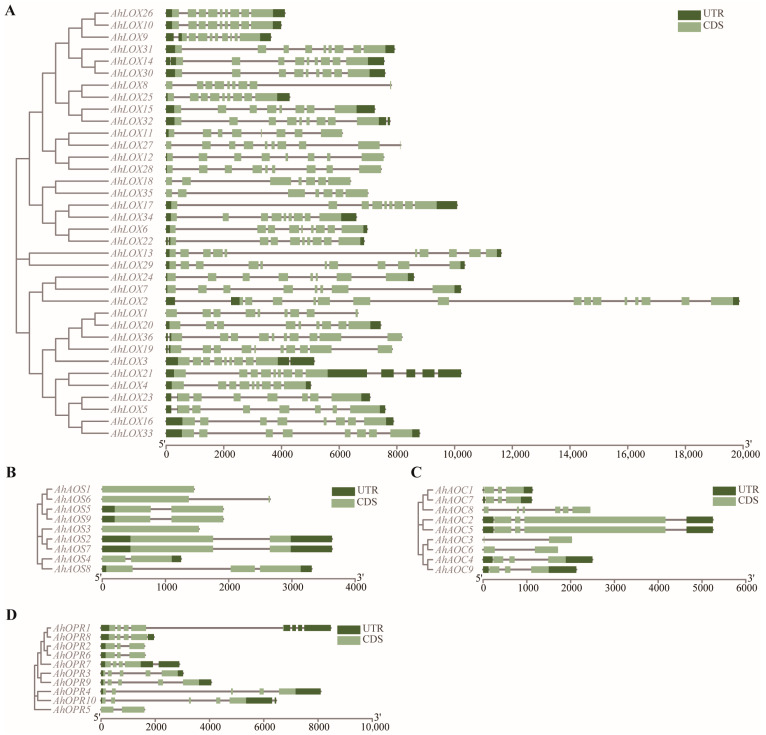
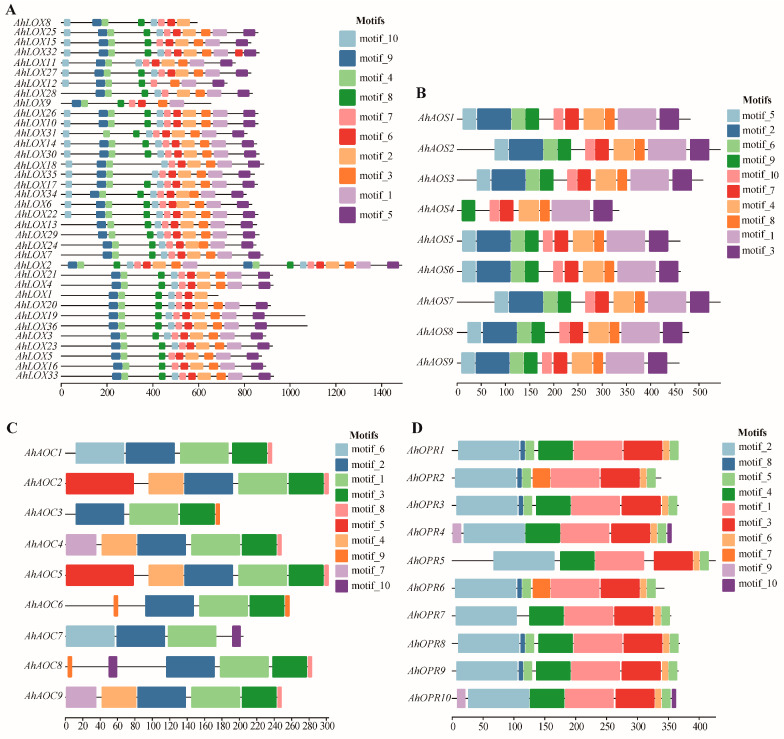
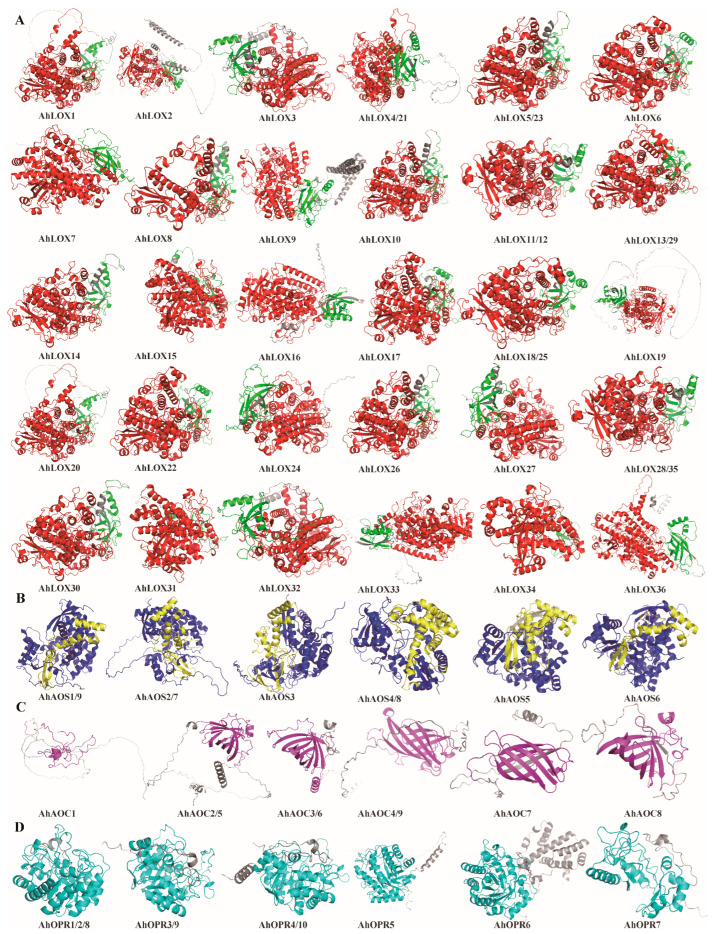
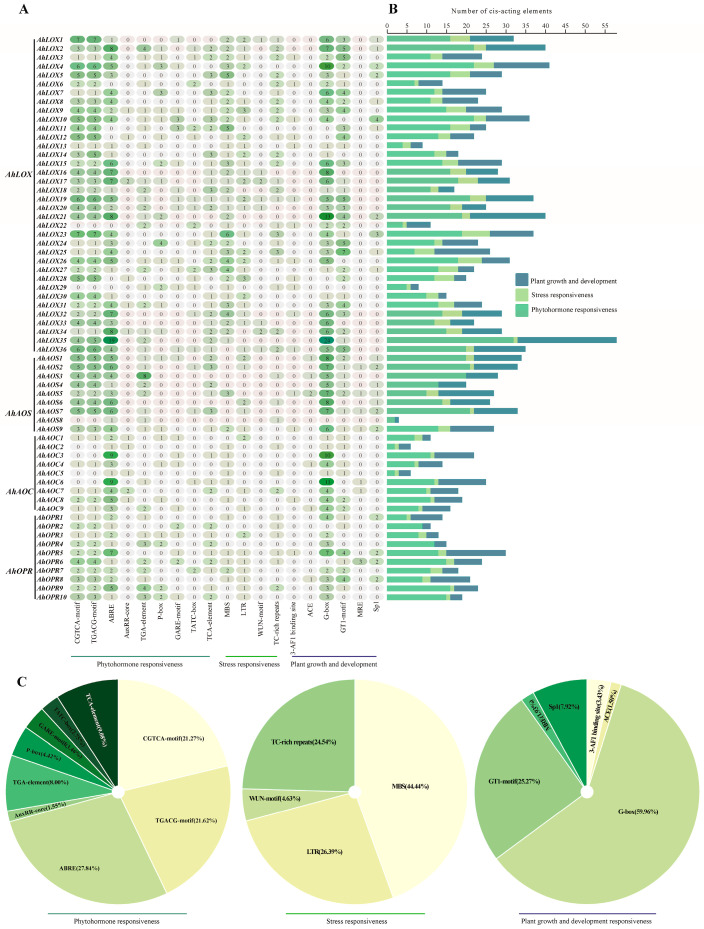
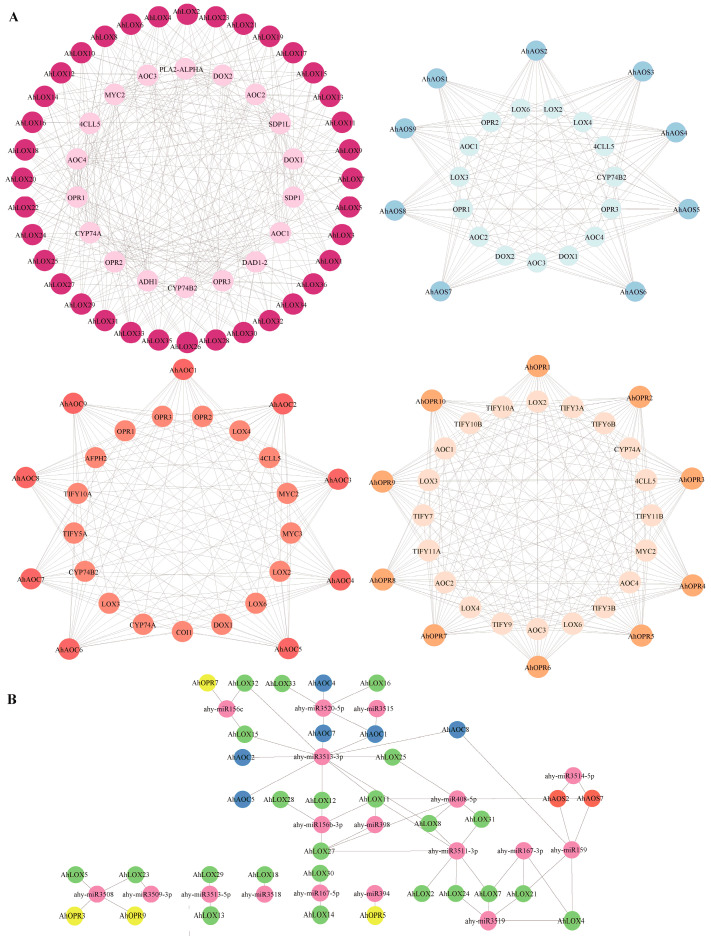
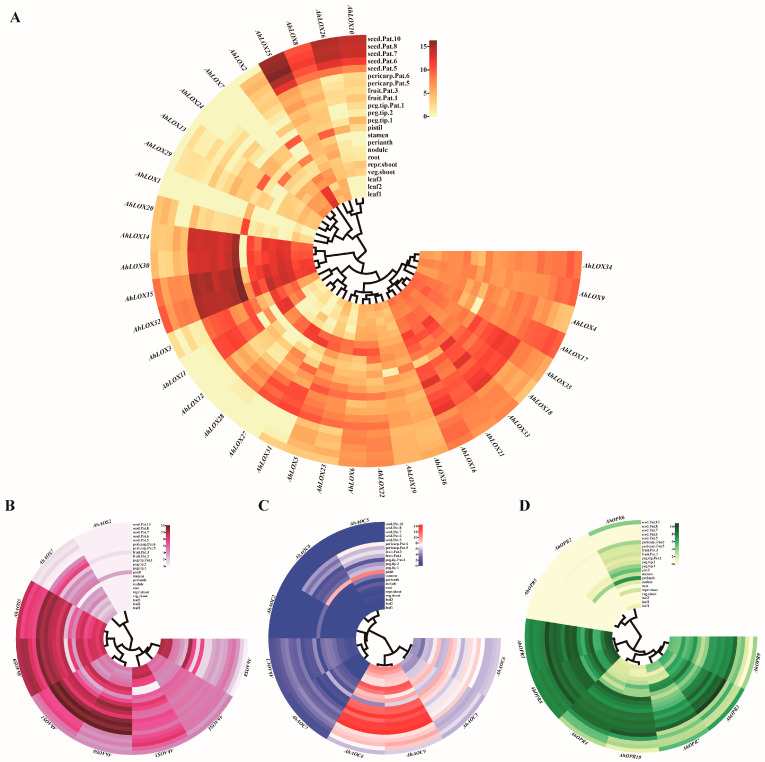
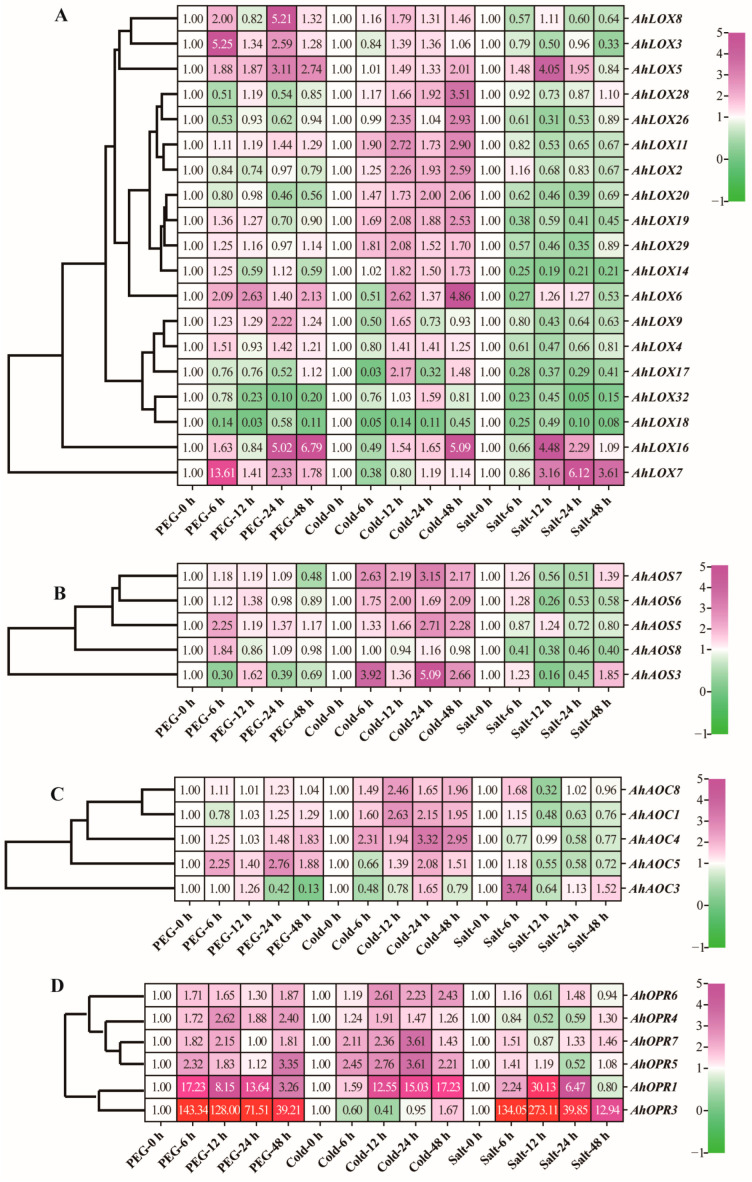
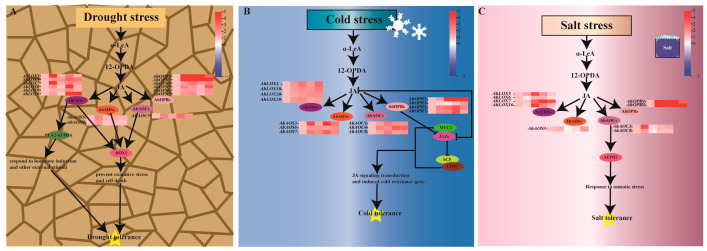
Abiotic stress is a limiting factor in peanut production. Peanut is an important oil crop and cash crop in China. Peanut yield is vulnerable to abiotic stress due to its seeds grown underground. Jasmonic acid (JA) is essential for plant growth and defense against adversity stresses. However, the regulation and mechanism of the jasmonic acid biosynthesis pathway on peanut defense against abiotic stresses are still limitedly understood. In this study, a total of 64 genes encoding key enzymes of JA biosynthesis were identified and classified into lipoxygenases (AhLOXs), alleno oxide synthases (AhAOSs), allene oxide cyclases (AhAOCs), and 12-oxo-phytodienoic acid reductases (AhOPRs) according to gene structure, conserved motif, and phylogenetic feature. A cis-regulatory element analysis indicated that some of the genes contained stress responsive and hormone responsive elements. In addition to proteins involved in JA biosynthesis and signaling, they also interacted with proteins involved in lipid biosynthesis and stress response. Sixteen putative Ah-miRNAs were identified from four families targeting 35 key genes of JA biosynthesis. A tissue expression pattern analysis revealed that AhLOX2 was the highest expressed in leaf tissues, and AhLOX32 was the highest expressed in shoot, root, and nodule tissues. AhLOX16, AhOPR1, and AhOPR3 were up-regulated under drought stress. AhLOX16, AhAOS3, AhOPR1, and AhAOC4 had elevated transcript levels in response to cold stress. AhLOX5, AhLOX16, AhAOC3, AhOPR1, and AhOPR3 were up-regulated for expression under salt stress. Our study could provide a reference for the study of the abiotic stress resistance mechanism in peanut.
Keywords: abiotic stress; genome-wide; jasmonic acid biosynthesis; peanut.
Conflict of interest statement
The authors declare no conflicts of interest.
Figures
Similar articles
-
Genome-Wide Identification, Functional Characterization, and Stress-Responsive Expression Profiling of Subtilase (SBT) Gene Family in Peanut (Arachis hypogaea L.).Int J Mol Sci. 2024 Dec 13;25(24):13361. doi: 10.3390/ijms252413361. Int J Mol Sci. 2024. PMID: 39769126 Free PMC article.
-
Genome-Wide Analysis Elucidates the Roles of AhLBD Genes in Different Abiotic Stresses and Growth and Development Stages in the Peanut (Arachis hypogea L.).Int J Mol Sci. 2024 Sep 30;25(19):10561. doi: 10.3390/ijms251910561. Int J Mol Sci. 2024. PMID: 39408886 Free PMC article.
-
Expression dynamics indicate the role of Jasmonic acid biosynthesis pathway in regulating macronutrient (N, P and K+) deficiency tolerance in rice (Oryza sativa L.).Plant Cell Rep. 2021 Aug;40(8):1495-1512. doi: 10.1007/s00299-021-02721-5. Epub 2021 Jun 5. Plant Cell Rep. 2021. PMID: 34089089
-
Jasmonic acid: a key frontier in conferring abiotic stress tolerance in plants.Plant Cell Rep. 2021 Aug;40(8):1513-1541. doi: 10.1007/s00299-020-02614-z. Epub 2020 Oct 9. Plant Cell Rep. 2021. PMID: 33034676 Review.
-
Jasmonic Acid Signaling Pathway in Response to Abiotic Stresses in Plants.Int J Mol Sci. 2020 Jan 17;21(2):621. doi: 10.3390/ijms21020621. Int J Mol Sci. 2020. PMID: 31963549 Free PMC article. Review.
Cited by
-
Elucidating the Role of SlBBX31 in Plant Growth and Heat-Stress Resistance in Tomato.Int J Mol Sci. 2024 Aug 27;25(17):9289. doi: 10.3390/ijms25179289. Int J Mol Sci. 2024. PMID: 39273241 Free PMC article.
-
Genome-wide and transcriptome analysis of PdWRKY transcription factors in date palm (Phoenix dactylifera) revealing insights into heat and drought stress tolerance.BMC Genomics. 2025 Jul 1;26(1):589. doi: 10.1186/s12864-025-11715-6. BMC Genomics. 2025. PMID: 40597593 Free PMC article.
-
Identification, Phylogeny, and Expression Profiling of Pineapple Heat Shock Proteins (HSP70) Under Various Abiotic Stresses.Int J Mol Sci. 2024 Dec 14;25(24):13407. doi: 10.3390/ijms252413407. Int J Mol Sci. 2024. PMID: 39769172 Free PMC article.
-
Genome-Wide Analysis of the 12-Oxo-Phytodienoic Acid Reductase Gene Family in Peanut and Functional Characterization of AhOPR6 in Salt Stress.Plants (Basel). 2025 May 8;14(10):1408. doi: 10.3390/plants14101408. Plants (Basel). 2025. PMID: 40430975 Free PMC article.
References
MeSH terms
Substances
Grants and funding
LinkOut - more resources
Full Text Sources
