. 2024 Jun 29;25(13):7190.
doi: 10.3390/ijms25137190.

Uncovering PheCLE1 and PheCLE10 Promoting Root Development Based on Genome-Wide Analysis

Affiliations

Uncovering PheCLE1 and PheCLE10 Promoting Root Development Based on Genome-Wide Analysis

Changhong Mu et al. Int J Mol Sci. .

Abstract

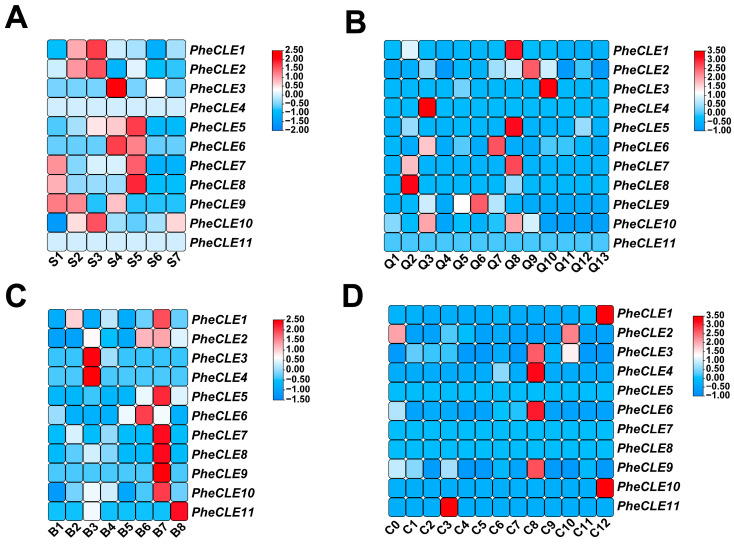
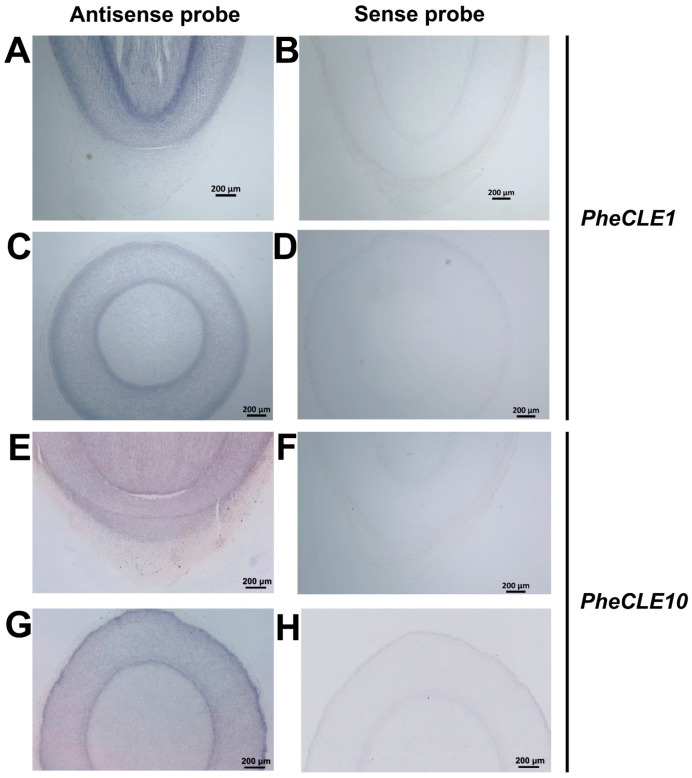
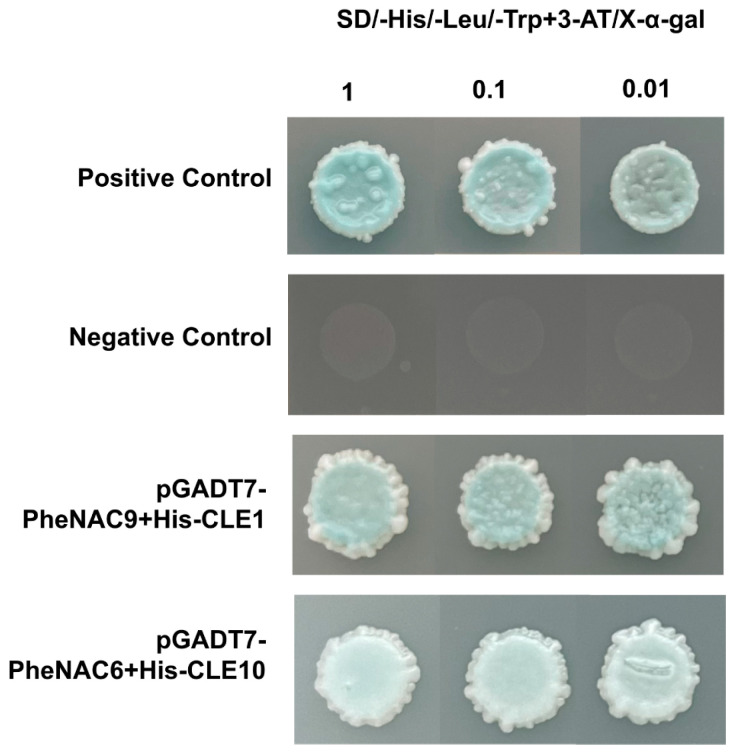
Moso bamboo (Phyllostachys edulis), renowned for its rapid growth, is attributed to the dynamic changes in its apical meristem. The CLAVATA3/EMBRYO SURROUNDING REGION-RELATED (CLE) family genes are known to play crucial roles in regulating meristem and organ formation in model plants, but their functions in Moso bamboo remain unclear. Here, we conducted a genome-wide identification of the CLE gene family of Moso bamboo and investigated their gene structure, chromosomal localization, evolutionary relationships, and expression patterns. A total of 11 PheCLE genes were identified, all of which contained a conserved CLE peptide core functional motif (Motif 1) at their C-termini. Based on Arabidopsis classification criteria, these genes were predominantly distributed in Groups A-C. Collinearity analysis unveiled significant synteny among CLE genes in Moso bamboo, rice, and maize, implying potential functional conservation during monocot evolution. Transcriptomic analysis showed significant expression of these genes in the apical tissues of Moso bamboo, including root tips, shoot tips, rhizome buds, and flower buds. Particularly, single-cell transcriptomic data and in situ hybridization further corroborated the heightened expression of PheCLE1 and PheCLE10 in the apical tissue of basal roots. Additionally, the overexpression of PheCLE1 and PheCLE10 in rice markedly promoted root growth. PheCLE1 and PheCLE10 were both located on the cell membrane. Furthermore, the upstream transcription factors NAC9 and NAC6 exhibited binding affinity toward the promoters of PheCLE1 and PheCLE10, thereby facilitating their transcriptional activation. In summary, this study not only systematically identified the CLE gene family in Moso bamboo for the first time but also emphasized their central roles in apical tissue development. This provides a valuable theoretical foundation for the further exploration of functional peptides and their signaling regulatory networks in bamboo species.

Keywords: CLE gene family; Moso bamboo; PheCLE1; PheCLE10; apical tissue development.


Conflict of interest statement

The authors declare no conflicts of interest.

Figures

Figure 1
Figure 1
Chromosome locations of CLE gene family members of Moso bamboo. Striped boxes represent chromosomes containing gene density information. The scale represents the length of the Moso bamboo chromosomes. Red font represents members of the bamboo CLE gene family, and green font represents Moso bamboo chromosomes. Y-axis: Chromosome length (Megabases, Mb). X-axis: Chromosome numbers.
Figure 2
Figure 2
Gene structure and conserved motif analysis of CLE gene family members in Moso bamboo. The left figure represents the phylogenetic and conserved motif analysis of the CLE family with different colored squares representing different conserved motifs. The right figure represents the gene structure of CLE family members, where the blue square represents the UTR region, the orange square represents the exon, and the black line represents the intron. The left axis: Conserved Motif Length (amino acids, aa). The right axis: Gene Structure Length (base pairs, bp).
Figure 3
Figure 3
Evolutionary analysis of the CLE gene family. The 110 CLE protein sequences from Arabidopsis, rice, maize, and Moso bamboo can be divided into four subgroups: A, B, C, and D. The red font represents the Moso bamboo CLEs, and bootstrap values are represented by triangles of different sizes.
Figure 4
Figure 4
Collinearity analysis of CLE gene family members. (A) In the collinearity region of CLE family members within Moso bamboo, the red and green lines indicate the duplication relationship between two pairs of PheCLE genes. (B) The collinear relationship between Moso bamboo, rice, and maize CLE members. The relationship of duplicated genes between PheCLEs, OsCLEs, and ZmCLEs was indicated with red lines.
Figure 5
Figure 5
Analysis of promoter regions in the PheCLE genes. The blocks of different colors represent different cis-acting elements, and the heatmap represents the number of cis-acting elements for each PheCLE gene. The darker the color, the more components there are.
Figure 6
Figure 6
Analysis of PheCLE gene expression patterns based on transcriptome data. (A) Expression levels of PheCLE genes in different developmental stages of Moso bamboo shoots. S1: winter bamboo shoot tip, S2: 50 cm spring bamboo shoot tip, S3: 100 cm spring bamboo shoot tip, S4: 300 cm spring bamboo shoot tip, S5: 600 cm spring bamboo shoot tip, S6: 900 cm spring bamboo shoot tip, S7: 1200 cm spring bamboo shoot tip. (B) Expression levels of PheCLE genes in different tissue types of Moso bamboo. Q1: Rhizome, Q2: Rhizome bud, Q3: Rhizome root, Q4: 0.1 cm root on bamboo shoot, Q5: 0.5 cm root on bamboo shoot, Q6: 2 cm root on bamboo shoot, Q7: 10 cm root on bamboo shoot, Q8: 300 cm bamboo shoot tip, Q9: 300 cm bamboo shoot in the middle, Q10: 300 cm bamboo shoot base, Q11: Leaf, S12: Leaf sheath, S13: Culm sheath. (C) Expression levels of PheCLE genes in different floral organs of bamboo. B1: Leaves, B2: Pistils, B3: Stamens, B4: Young embryos, B5: Glumes, B6: Lemma, B7: Flower bud, B8: Bracts. (D) Expression profiles of PheCLE genes across different cell groups in the basal root apical tissue of Moso bamboo. Specifically, C0, C1, C5, and C10 corresponded to ground tissues, C2 to transition cells, C6 to the epidermis, C7, C8, C11, and C12 to the root cap, C9 to initial cells, and C3 and C4 to undefined tissues.
Figure 7
Figure 7
In situ hybridization experiment of PheCLE1 and PheCLE10 in the basal root tips of Moso bamboo. Longitudinal (A,B,E,F) and cross (C,D,G,H) sections of the root tip tissue of Moso bamboo basal root. In addition, (A,C,E,G) are the hybridization results of the target gene antisense probe, while (B,D,F,H) are the hybridization results of the target gene sense probe. Bar = 200 µm.
Figure 8
Figure 8
Functional analysis of PheCLE1 and PheCLE10 genes. (A) Phenotypic analysis of WT and PheCLE1 and PheCLE10 transgenic lines rice seeds after 7 days of germination. Bar = 10 mm. Quantification of total root length in WT, PheCLE1-OE, and PheCLE10-OE lines. Data are means ± SE (n = 15 roots). Asterisks indicate a statistically significant difference between WT and transgenic plants (t-test, **** p < 0.0001). (B) Subcellular localization analysis of PheCLE1 and PheCLE10 in tobacco leaves. Vectors carrying 35S::PheCLE1-eGFP and 35S::PheCLE10-eGFP were transiently transformed into tobacco leaves, using 35S::eGFP as the positive control and YFP as the cell membrane marker. Images of N. benthamiana leaves were captured 48 h post-infiltration using confocal microscopy. Bar = 50 µm.
Figure 9
Figure 9
PheCLE1 and PheCLE10 genes yeast one-hybrid results. pHis2-53+pGADT7-53 was used for positive reference, and pHis2-53+pGADT7-Rec2 was used for negative reference. Growth patterns of the transformants at dilutions of 1, 0.1, and 0.01 on SD/-His-Leu-Trp plates.
Figure 10
Figure 10
PheCLE1 and PheCLE10 genes dual luciferase experiment results. (A) Schematic representations of the reporter and effector constructs. (B) The luminescence ratio of firefly LUC to Renilla LUC. Results are expressed as means ± standard error for three replicates. Statistical significance compared to the control with empty vector is denoted by asterisks (t-test, * p < 0.05, *** p < 0.001).

References

    1. INBAR . 2022 Global Bamboo and Rattan Commodities International Trade Report. International Bamboo and Rattan Organization; Beijing, China: 2023. [(accessed on 25 April 2024)]. Available online: https://www.inbar.int/resources/inbar_publications/2022zgztspgjmybg/
    1. Yang J.B., Dong Y.R., Wong K.M., Gu Z.J., Yang H.Q., Li D.Z. Genetic structure and differentiation in Dendrocalamus sinicus (Poaceae: Bambusoideae) populations provide insight into evolutionary history and speciation of woody bamboos. Sci. Rep. 2018;8:16933. doi: 10.1038/s41598-018-35269-8. - DOI - PMC - PubMed
    1. Iroegbu A.O.C., Ray S.S. Bamboos: From bioresource to sustainable materials and chemicals. Sustainability. 2021;13:12200. doi: 10.3390/su132112200. - DOI
    1. Zhou G., Gu L., Chai Q., Zhang J., Zhu W., Zhang Z. Carbon footprints labeling of bamboo products: A powerful tool to promote innovative development of bamboo industry. World Bamboo Ratt. 2022;20:29.
    1. Chen M., Guo L., Ramakrishnan M., Fei Z., Vinod K.K., Ding Y., Jiao C., Gao Z., Zha R., Wang C., et al. Rapid growth of Moso bamboo (Phyllostachys edulis): Cellular roadmaps, transcriptome dynamics, and environmental factors. Plant Cell. 2022;34:3577–3610. doi: 10.1093/plcell/koac193. - DOI - PMC - PubMed

LinkOut - more resources