

A Positive Feedback Loop Exists between Estradiol and IL-6 and Contributes to Dermal Fibrosis
- PMID: 39000334
- PMCID: PMC11241801
- DOI: 10.3390/ijms25137227
A Positive Feedback Loop Exists between Estradiol and IL-6 and Contributes to Dermal Fibrosis
Abstract
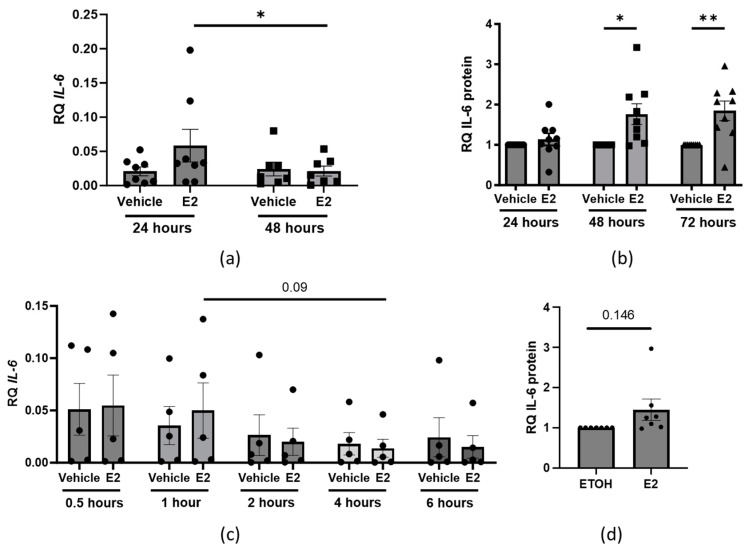
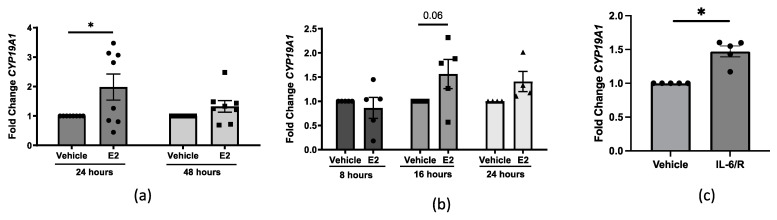
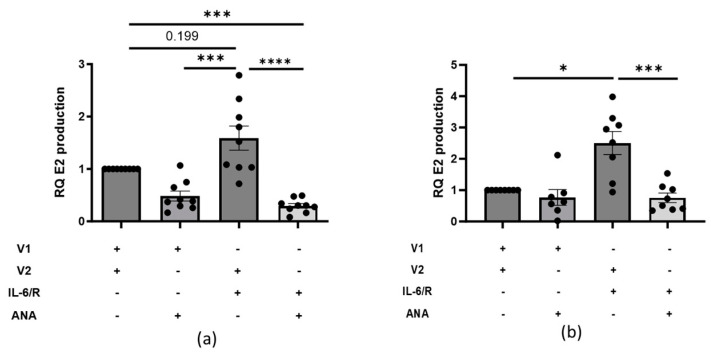
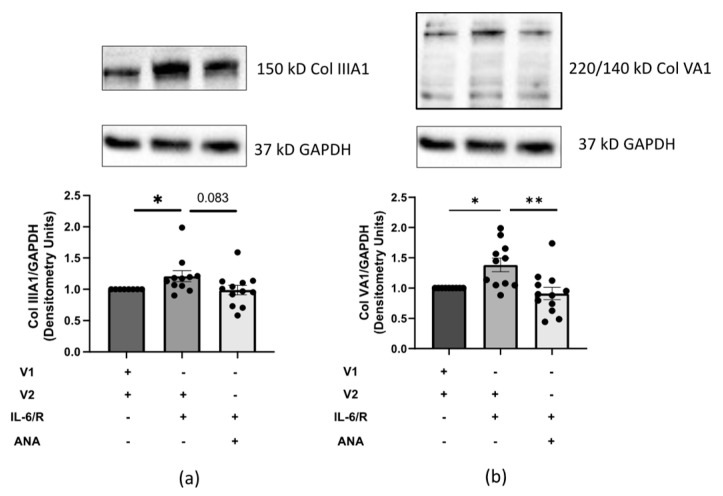
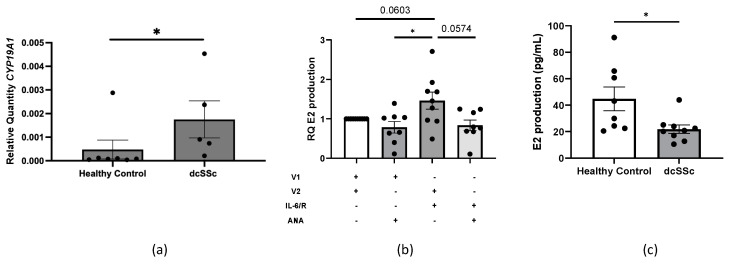
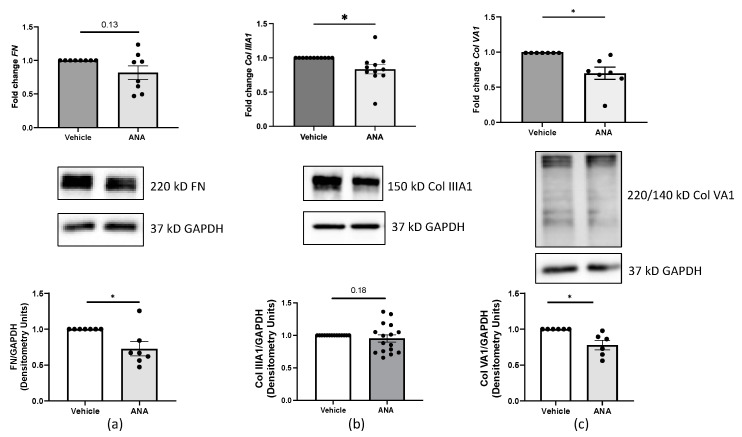
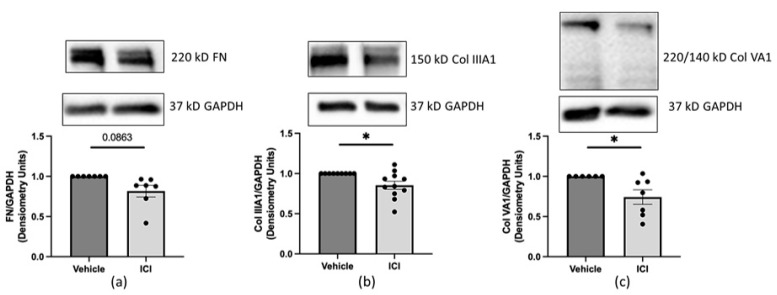
Systemic sclerosis (SSc) is characterized by dermal fibrosis with a female predominance, suggesting a hormonal influence. Patients with SSc have elevated interleukin (IL)-6 levels, and post-menopausal women and older men also have high estradiol (E2) levels. In the skin, IL-6 increases the enzymatic activity of aromatase, thereby amplifying the conversion of testosterone to E2. Therefore, we hypothesized that an interplay between E2 and IL-6 contributes to dermal fibrosis. We used primary dermal fibroblasts from healthy donors and patients with diffuse cutaneous (dc)SSc, and healthy donor skin tissues stimulated with recombinant IL-6 and its soluble receptor (sIL-6R) or E2. Primary human dermal fibroblasts and tissues from healthy donors stimulated with IL-6+sIL-6R produced E2, while E2-stimulated dermal tissues and fibroblasts produced IL-6. Primary dermal fibroblasts from healthy donors treated with IL-6+sIL-6R and the aromatase inhibitor anastrozole (ANA) and dcSSc fibroblasts treated with ANA produced less fibronectin (FN), type III collagen A1 (Col IIIA1), and type V collagen A1 (Col VA1). Finally, dcSSc dermal fibroblasts treated with the estrogen receptor inhibitor fulvestrant also generated less FN, Col IIIA1, and Col VA1. Our data show that IL-6 exerts its pro-fibrotic influence in human skin in part through E2 and establish a positive feedback loop between E2 and IL-6.
Keywords: IL-6; aromatase; dermal fibrosis; estradiol; systemic sclerosis.
Conflict of interest statement
DeAnna Baker Frost is a medical consultant for Boehringer Ingelheim. The funders had no role in the design of the study, in the collection, analyses, or interpretation of data, in the writing of the manuscript, or in the decision to publish the results.
Figures
Similar articles
-
Critical Role for Transglutaminase 2 in Scleroderma Skin Fibrosis and in the Development of Dermal Sclerosis in a Mouse Model of Scleroderma.Arthritis Rheumatol. 2025 Jul;77(7):914-928. doi: 10.1002/art.43104. Epub 2025 May 19. Arthritis Rheumatol. 2025. PMID: 39800950 Free PMC article.
-
Targeting CD13/Aminopeptidase N as a Novel Therapeutic Approach for Scleroderma Fibrosis.Arthritis Rheumatol. 2025 Jan;77(1):80-91. doi: 10.1002/art.42973. Epub 2024 Sep 18. Arthritis Rheumatol. 2025. PMID: 39175116 Free PMC article.
-
EphB2 Receptor Promotes Dermal Fibrosis in Systemic Sclerosis.Arthritis Rheumatol. 2024 Aug;76(8):1303-1316. doi: 10.1002/art.42858. Epub 2024 May 15. Arthritis Rheumatol. 2024. PMID: 38589317 Free PMC article.
-
Therapeutic Approaches to Systemic Sclerosis: Recent Approvals and Future Candidate Therapies.Clin Rev Allergy Immunol. 2023 Jun;64(3):239-261. doi: 10.1007/s12016-021-08891-0. Epub 2021 Sep 1. Clin Rev Allergy Immunol. 2023. PMID: 34468946 Free PMC article. Review.
-
Stem cell transplantation for systemic sclerosis.Cochrane Database Syst Rev. 2022 Jul 29;7(7):CD011819. doi: 10.1002/14651858.CD011819.pub2. Cochrane Database Syst Rev. 2022. PMID: 35904231 Free PMC article.
Cited by
-
Crosstalk between perivascular adipose tissue and adipocyte-derived peptide in the pathogenesis of diabetic cardiomyopathy.Cardiovasc Diabetol. 2025 Aug 13;24(1):332. doi: 10.1186/s12933-025-02863-w. Cardiovasc Diabetol. 2025. PMID: 40804626 Review.
References
-
- Malcarne V.L., Hansdottir I., McKinney A., Upchurch R., Greenbergs H.L., Henstorf G.H., Furst D.E., Clements P.J., Weisman M.H. Medical Signs and Symptoms Associated with Disability, Pain, and Psychosocial Adjustment in Systemic Sclerosis. J. Rheumatol. 2007;34:359–367. - PubMed
-
- Feghali C.A., Bost K.L., Boulware D.W., Levy L.S. Mechanisms of Pathogenesis in Scleroderma. I. Overproduction of Interleukin 6 by Fibroblasts Cultured from Affected Skin Sites of Patients with Scleroderma. J. Rheumatol. 1992;19:1207–1211. - PubMed
MeSH terms
Substances
Grants and funding
- 1P30AR072582-01A1/NH/NIH HHS/United States
- 1K08AR078372-01A1/NH/NIH HHS/United States
- 1T32AR050958-01A1/NH/NIH HHS/United States
- KL2 TR001452/TR/NCATS NIH HHS/United States
- P30 AR072582/AR/NIAMS NIH HHS/United States
- 1K24AR060297-01A1/NH/NIH HHS/United States
- T32 AR050958/AR/NIAMS NIH HHS/United States
- Career Development Bridge Funding Award: K-Bridge/American College of Rheumatology Research Foundation
- K08 AR078372/AR/NIAMS NIH HHS/United States
- K24 AR060297/AR/NIAMS NIH HHS/United States
- UL1 TR001450/TR/NCATS NIH HHS/United States
- New Investigator Award/National Scleroderma Foundation
LinkOut - more resources
Full Text Sources
Medical
Miscellaneous
