. 2024 Jul 5;25(13):7409.
doi: 10.3390/ijms25137409.

Toxic Advanced Glycation End-Products Inhibit Axonal Elongation Mediated by β-Tubulin Aggregation in Mice Optic Nerves

Affiliations

Toxic Advanced Glycation End-Products Inhibit Axonal Elongation Mediated by β-Tubulin Aggregation in Mice Optic Nerves

Hayahide Ooi et al. Int J Mol Sci. .

Abstract

Advanced glycation end-products (AGEs) form through non-enzymatic glycation of various proteins. Optic nerve degeneration is a frequent complication of diabetes, and retinal AGE accumulation is strongly linked to the development of diabetic retinopathy. Type 2 diabetes mellitus is a major risk factor for Alzheimer's disease (AD), with patients often exhibiting optic axon degeneration in the nerve fiber layer. Notably, a gap exists in our understanding of how AGEs contribute to neuronal degeneration in the optic nerve within the context of both diabetes and AD. Our previous work demonstrated that glyceraldehyde (GA)-derived toxic advanced glycation end-products (TAGE) disrupt neurite outgrowth through TAGE-β-tubulin aggregation and tau phosphorylation in neural cultures. In this study, we further illustrated GA-induced suppression of optic nerve axonal elongation via abnormal β-tubulin aggregation in mouse retinas. Elucidating this optic nerve degeneration mechanism holds promise for bridging the knowledge gap regarding vision loss associated with diabetes mellitus and AD.

Keywords: axonal elongation; glyceraldehyde; tau; toxic advanced glycation end-products; β-tubulin.


Conflict of interest statement

The authors declare no conflicts of interest.

Figures

Figure 1
Figure 1
GA increased TAGE–β-tubulin and β-tubulin aggregation in the retina in a time-dependent manner. (A) TAGE levels were measured using slot blot analysis with an anti-TAGE antibody. The graph shows the intensity of the TAGE band in the slot blot. ** p < 0.01, * p < 0.05 vs. day 0 (n = 3). (BE) Level of β-tubulin aggregation detected using an anti-β-tubulin antibody. (B) Western blot obtained using the anti-β-tubulin antibody: U: Upper band, L: Lower band, M: Monomer band. (C) The intensity of the upper β-tubulin bands upon GA treatment. (D) The intensity of the lower β-tubulin bands upon GA treatment. (E) The intensity of the monomer β-tubulin bands upon GA treatment. ** p < 0.05 vs. day 0 (n = 3).
Figure 2
Figure 2
TAGE colocalized with β-tubulin in the retina upon intraocular injection of GA. (A,D,G) Immunoreactivity of β-tubulin was increased in GCL and NFL at 1–3 days after intraocular injection of GA (A) day 0, (D) day 1, (G) day 3. (B,E,H) Immunoreactivity of TAGE, (B) day 0, (E) day 1, (H) day 3. (C,F,I) Merged images. Arrowhead: Colocalization of TAGE and β-tubulin. GCL: ganglion cell layer, NFL: nerve fiber layer. Scale = 100 μm.
Figure 3
Figure 3
PM inhibited GA-induced TAGE formation and β-tubulin aggregation in the retina. (A) TAGE levels were measured using slot blot analysis with an anti-TAGE antibody at 3 days of treatment. The histogram shows the intensity of the TAGE bands in the slot blot. ** p < 0.01, * p < 0.05 vs. vehicle control. + p < 0.01 vs. GA alone (n = 3). (B) β-Tubulin levels detected using an anti-β-tubulin antibody (3-day treated retinal samples). U: Upper band, L: Lower band, M: Monomer band. (CE) The intensity of the upper (C), lower (D), and monomer (E) β-tubulin bands upon GA treatment. ** p < 0.05 vs. vehicle control, + p < 0.01 vs. GA alone (n = 3).
Figure 4
Figure 4
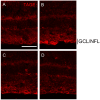
PM dose-dependently suppressed TAGE formation in GCL and NFL. (AD) PM dose-dependently suppressed TAGE formation in GCL and NFL in retina. (A) 0 day, (B) GA, (C) GA plus 250 μM PM, (D) GA plus 500 μM PM. Scale = 100 μm.
Figure 5
Figure 5
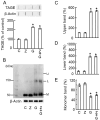
Zymosan did not affect TAGE formation and TAGE–β-tubulin aggregation by GA in the retina after optic nerve injury. (A) TAGE levels were measured using slot blot analysis with an anti-TAGE antibody. The histogram shows the intensity of the TAGE bands in the slot blot. * p < 0.01 vs. vehicle control (n = 3). (BE) Levels of β-tubulin aggregation detected using an anti-β-tubulin antibody. (B) Western blot obtained using the anti-β-tubulin antibody. U: Upper band, L: Lower band, M: Monomer band. (C) The intensity of the upper β-tubulin band upon GA treatment. (D) The intensity of the lower β-tubulin band upon GA treatment. (E) The intensity of the monomer β-tubulin band upon GA treatment. * p < 0.01 vs. vehicle control (n = 3). C: vehicle control, Z: zymosan (12.5 μg/mL), G: GA (1 mM), Z+G: zymosan plus GA.
Figure 6
Figure 6
Axonal elongation induced by GA was dependent on TAGE. (AD) Longitudinal sections of the adult mouse optic nerve showing GAP-43-positive axons extending over the injury site (asterisks) after 10 days of optic nerve injury. (A) Vehicle control, (B) Zymosan, (C) Zymosan plus GA, (D) Zymosan plus GA plus PM, (E) Quantification of axonal elongation at a point 250 μm distant from the injury site. ** p < 0.05 vs. vehicle control. + p < 0.05 vs. zymosan alone. # p < 0.01 vs. zymosan plus GA (n = 8, 6 mice per each group). Scale = 100 μm.
Figure 7
Figure 7
PM decreased the levels of phosphorylated tau induced by GA. (A) Western blot images showing the levels of total and phosphorylated tau (P-Tau). (B) Graphical representation of the intensity of Total-tau and (C) P-tau bands in the Western blot images shown in (A). ** p < 0.01 vs. vehicle control, + p < 0.01 vs. GA alone (n = 3).

References

    1. Takeuchi M., Sakasai-Sakai A., Takata T., Takino J.I., Koriyama Y. Effects of toxic AGEs (TAGE) on human health. Cells. 2022;11:2178. doi: 10.3390/cells11142178. - DOI - PMC - PubMed
    1. Sato T., Shimogaito N., Wu X., Kikuchi S., Yamagishi S., Takeuchi M. Toxic advanced glycation end products (TAGE) theory in Alzheimer’s disease. Am. J. Alzheimer’s Dis. Other Dement. 2006;21:197–208. doi: 10.1177/1533317506289277. - DOI - PMC - PubMed
    1. Smith M.A., Taneda S., Richey P.L., Miyata S., Yan S.D., Stern D., Sayre L.M., Monnier V.M., Perry G. Advanced Maillard reaction end products are associated with Alzheimer disease pathology. Proc. Natl. Acad. Sci. USA. 1994;91:5710–5714. doi: 10.1073/pnas.91.12.5710. - DOI - PMC - PubMed
    1. Yan S.D., Yan S.F., Chen X., Fu J., Chen M., Kuppusamy P., Smith M.A., Perry G., Godman G.C., Nawroth P., et al. Non-enzymatically glycated tau in Alzheimer’s disease induces neuronal oxidant stress resulting in cytokine gene expression and release of amyloid beta-peptide. Nat. Med. 1995;1:693–699. doi: 10.1038/nm0795-693. - DOI - PubMed
    1. Oshitari T. Advanced glycation end-products and diabetic neuropathy of the retina. Int. J. Mol. Sci. 2023;24:2927. doi: 10.3390/ijms24032927. - DOI - PMC - PubMed

Grants and funding

LinkOut - more resources