. 2024 Jul 6;25(13):7422.
doi: 10.3390/ijms25137422.

Multi-Wavelength Raman Differentiation of Malignant Skin Neoplasms

Affiliations

Multi-Wavelength Raman Differentiation of Malignant Skin Neoplasms

Elena Rimskaya et al. Int J Mol Sci. .

Abstract

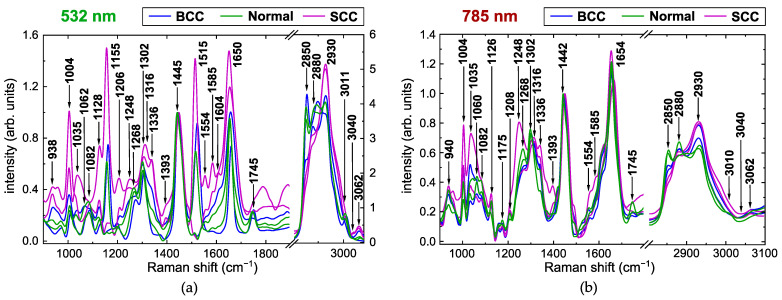
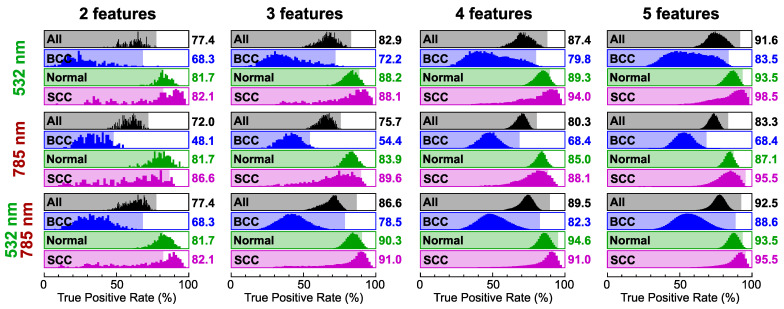
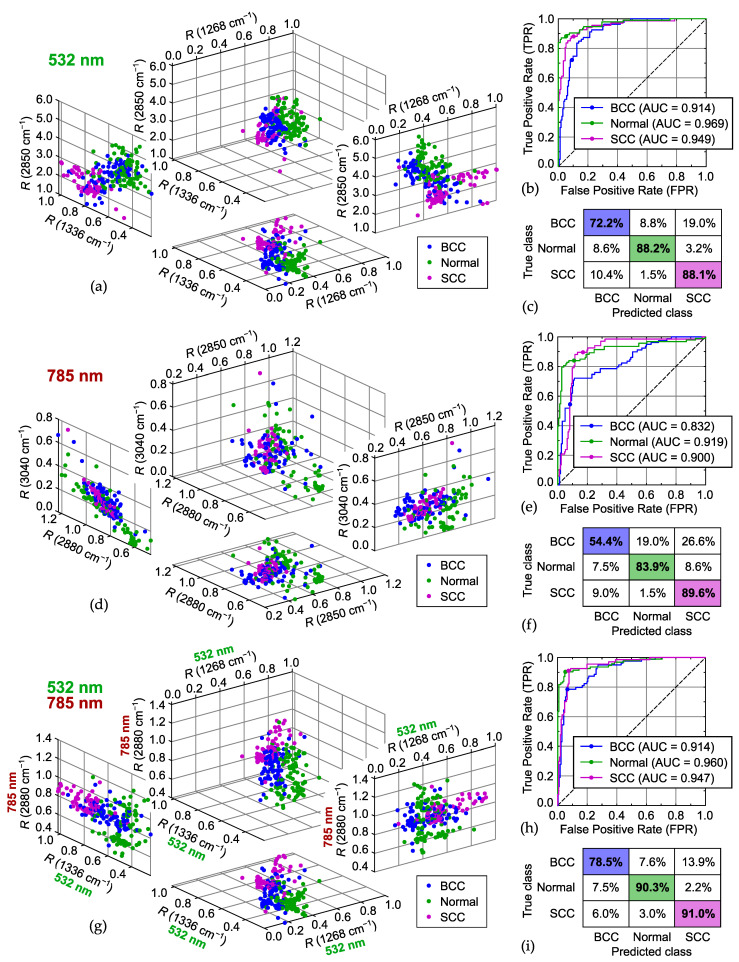
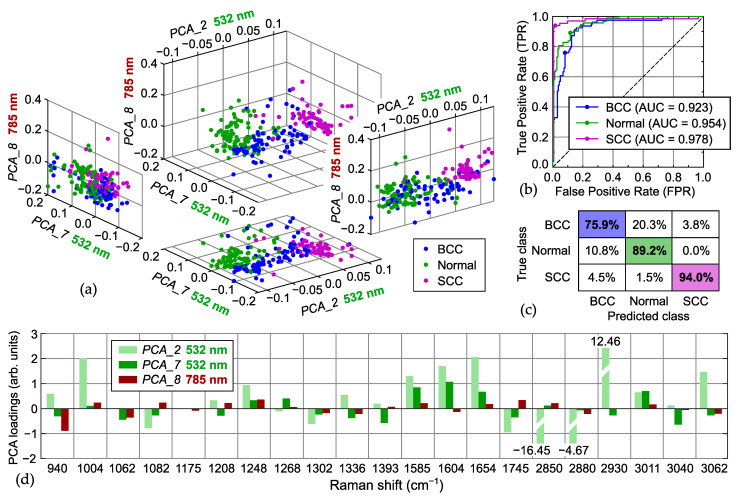
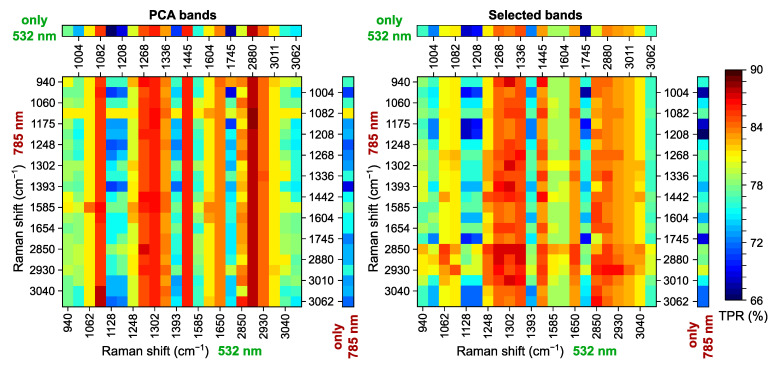
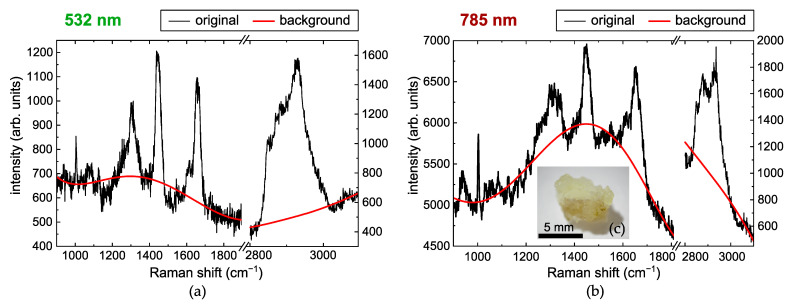
Raman microspectroscopy has become an effective method for analyzing the molecular appearance of biomarkers in skin tissue. For the first time, we acquired in vitro Raman spectra of healthy and malignant skin tissues, including basal cell carcinoma (BCC) and squamous cell carcinoma (SCC), at 532 and 785 nm laser excitation wavelengths in the wavenumber ranges of 900-1800 cm-1 and 2800-3100 cm-1 and analyzed them to find spectral features for differentiation between the three classes of the samples. The intensity ratios of the bands at 1268, 1336, and 1445 cm-1 appeared to be the most reliable criteria for the three-class differentiation at 532 nm excitation, whereas the bands from the higher wavenumber region (2850, 2880, and 2930 cm-1) were a robust measure of the increased protein/lipid ratio in the tumors at both excitation wavelengths. Selecting ratios of the three bands from the merged (532 + 785) dataset made it possible to increase the accuracy to 87% for the three classes and reach the specificities for BCC + SCC equal to 87% and 81% for the sensitivities of 95% and 99%, respectively. Development of multi-wavelength excitation Raman spectroscopic techniques provides a versatile non-invasive tool for research of the processes in malignant skin tumors, as well as other forms of cancer.

Keywords: Raman microspectroscopy; basal cell carcinoma; multispectral analysis; squamous cell carcinoma.


Conflict of interest statement

The authors declare no conflict of interest.

Figures

Figure 1
Figure 1
Examples of processed Raman spectra for basal cell carcinoma (BCC, blue curves), normal skin (Normal, green curves), and squamous cell carcinoma (SCC, purple curves) obtained at (a) 532 nm and (b) 785 nm excitation wavelengths. For each class, averaged spectra for two arbitrarily chosen samples are shown.
Figure 2
Figure 2
Correlation coefficients for peak intensities of main Raman bands calculated for spectra acquired at 532 nm (left panel) and 785 nm (right panel) excitation wavelengths.
Figure 3
Figure 3
Correlation coefficients for normalized peak intensities of main Raman bands calculated for spectra acquired at 532 nm (left panel) and 785 nm (right panel) excitation after division by peak intensities of 1445 cm−1 and 1442 cm−1 bands, respectively.
Figure 4
Figure 4
Histograms of true positive rate (TPR) values for BCC, normal skin (Normal), SCC, and all three classes (All) calculated for different numbers of selected spectral features (as indicated in the top part of each column) using data acquired at excitation wavelengths of 532 nm (top row) and 785 nm (middle row) as well as at both wavelengths (bottom row). The results for the set of features with the highest TPR for all classes are indicated by background color bars and values on the right side of each histogram.
Figure 5
Figure 5
Results of classification (BCC, Normal, SCC) obtained for datasets acquired at (ac) 532 nm, (df) 785 nm, and (gi) both excitation wavelengths: (a,d,g) distribution of normalized intensity values for three selected Raman bands, (b,e,h) receiver operating characteristic (ROC) curves (filled circle on each plot indicates selected working point), and (c,f,i) confusion matrices.
Figure 6
Figure 6
Results of classification (BCC, Normal, SCC) obtained for three principal component analysis (PCA) features (PCA_2, PCA_7, PCA_8) with the highest TPR using the data acquired at both excitation wavelengths (532 nm, 785 nm): (a) distribution of PCA coefficients (values), (b) ROC curves (filled circle on each plot indicates selected working point), (c) confusion matrices, and (d) PCA features (loadings).
Figure 7
Figure 7
Highest TPR for sets of three selected principle components (left panel, PCA bands) and Raman bands (right panel, Selected bands) calculated using different bands (as indicated near each row and column) for data normalization at both excitation wavelengths (532 nm, 785 nm, data matrix in the center) and single excitation wavelength (532 nm, top horizontal array; 785 nm, right vertical array).
Figure 8
Figure 8
Examples of original acquired spectra (black curves) and estimated fluorescence background signals (red curves) of the basal cell carcinoma sample for (a) 532 nm and (b) 785 nm excitation wavelengths, and (c) a photo of the sample.

Similar articles

Cited by

References

    1. Bray F., Laversanne M., Sung H., Ferlay J., Siegel R.L., Soerjomataram I., Jemal A. Global cancer statistics 2022: GLOBOCAN estimates of incidence and mortality worldwide for 36 cancers in 185 countries. CA Cancer J. Clin. 2024;74:229–263. doi: 10.3322/caac.21834. - DOI - PubMed
    1. Siegel R.L., Giaquinto A.N., Jemal A. Cancer statistics, 2024. CA A Cancer J. Clin. 2024;74:12–49. doi: 10.3322/caac.21820. - DOI - PubMed
    1. Rimskaya E., Shelygina S., Timurzieva A., Saraeva I., Perevedentseva E., Melnik N., Kudrin K., Reshetov D., Kudryashov S. Multispectral Raman Differentiation of Malignant Skin Neoplasms In Vitro: Search for Specific Biomarkers and Optimal Wavelengths. Int. J. Mol. Sci. 2023;24:14748. doi: 10.3390/ijms241914748. - DOI - PMC - PubMed
    1. Goel A., Tsikritsis D., Belsey N.A., Pendlington R., Glavin S., Chen T. Measurement of chemical penetration in skin using Stimulated Raman scattering microscopy and multivariate curve resolution-alternating least squares. Spectrochim. Acta Part A Mol. Biomol. Spectrosc. 2023;296:122639. doi: 10.1016/j.saa.2023.122639. - DOI - PubMed
    1. Gniadecka M., Philipsen P.A., Wessel S., Gniadecki R., Wulf H.C., Sigurdsson S., Nielsen O.F., Christensen D.H., Hercogova J., Rossen K., et al. Melanoma Diagnosis by Raman Spectroscopy and Neural Networks: Structure Alterations in Proteins and Lipids in Intact Cancer Tissue. J. Investig. Dermatol. 2004;122:443–449. doi: 10.1046/j.0022-202X.2004.22208.x. - DOI - PubMed

LinkOut - more resources