. 2024 Jul 8;25(13):7481.
doi: 10.3390/ijms25137481.

A Combined Metabolome and Transcriptome Reveals the Lignin Metabolic Pathway during the Developmental Stages of Peel Coloration in the 'Xinyu' Pear

Affiliations

A Combined Metabolome and Transcriptome Reveals the Lignin Metabolic Pathway during the Developmental Stages of Peel Coloration in the 'Xinyu' Pear

Cuicui Jiang et al. Int J Mol Sci. .

Abstract

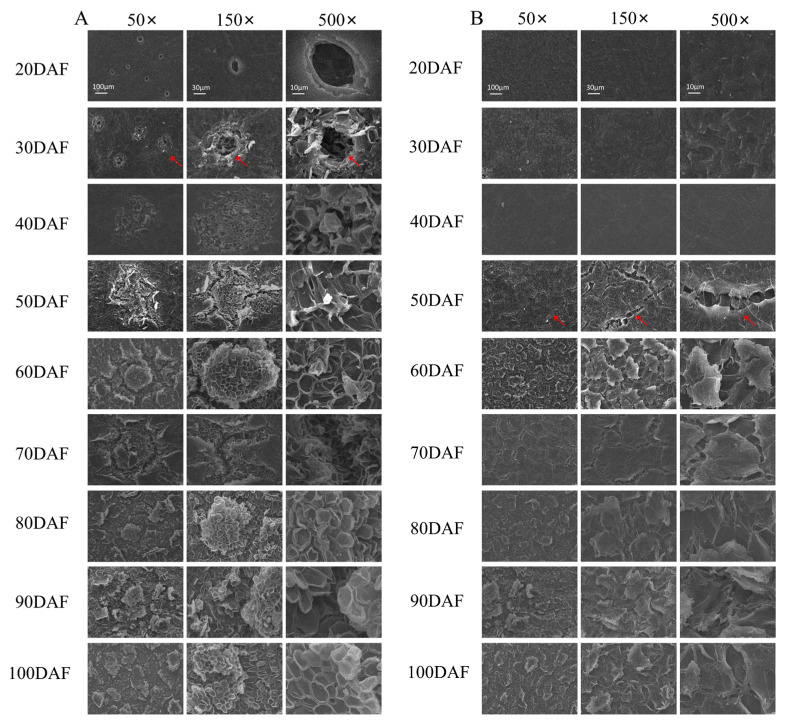
Sand pear is the main cultivated pear species in China, and brown peel is a unique feature of sand pear. The formation of brown peel is related to the activity of the cork layer, of which lignin is an important component. The formation of brown peel is intimately associated with the biosynthesis and accumulation of lignin; however, the regulatory mechanism of lignin biosynthesis in pear peel remains unclear. In this study, we used a newly bred sand pear cultivar 'Xinyu' as the material to investigate the biosynthesis and accumulation of lignin at nine developmental stages using metabolomic and transcriptomic methods. Our results showed that the 30 days after flowering (DAF) to 50DAF were the key periods of lignin accumulation according to data analysis from the assays of lignin measurement, scanning electron microscope (SEM) observation, metabolomics, and transcriptomics. Through weighted gene co-expression network analysis (WGCNA), positively correlated modules with lignin were identified. A total of nine difference lignin components were identified and 148 differentially expressed genes (DEGs), including 10 structural genes (PAL1, C4H, two 4CL genes, HCT, CSE, two COMT genes, and two CCR genes) and MYB, NAC, ERF, and TCP transcription factor genes were involved in lignin metabolism. An analysis of RT-qPCR confirmed that these DEGs were involved in the biosynthesis and regulation of lignin. These findings further help us understand the mechanisms of lignin biosynthesis and provide a theoretical basis for peel color control and quality improvement in pear breeding and cultivation.

Keywords: Pyrus pyrifolia; co-expression analysis; lignin biosynthesis; metabolome; peel color; transcriptome.


Conflict of interest statement

The authors declare no conflicts of interest.

Figures

Figure 1
Figure 1
The appearance of the ‘Xinyu’ pear at different stages of fruit development.
Figure 2
Figure 2
Lignin contents in the peel of the ‘Xinyu’ pear at the different development stages of fruit. Bars represent means ± standard deviation (n = 3). Differences among the samples at nine development stages were analyzed by multiple comparisons of a one-way ANOVA (Fisher method) with three biological replicates. The bars sharing the same letter do not have a significant difference from each other, but any two bars with different letters have a significant difference with p < 0.05.
Figure 3
Figure 3
Scanning electron microscopy (SEM) of the peel of the ‘Xinyu’ pear at different stages of fruit development. (A): Fruit pores; (B): fruit surface. (A): The red arrows indicate the period when the fruit spots began to form. (B): The red arrows indicate the period when the fruit surface began to crack. The bars in 20DAF are shared by each single drawing per column.
Figure 4
Figure 4
A heatmap of nine different lignin-related metabolites in the peel at different developmental stages of the ‘Xinyu’ pear. The contents of lignin-related metabolites were visualized following the respective normalized value (n = 3). The color scale indicates the value of normalization content for each metabolite, with blue representing a lower content and red representing a higher content.
Figure 5
Figure 5
The transcriptome sequencing data at the different stages of fruit development of the ‘Xinyu’ pear. (A): A heatmap of 28,293 expression genes that were divided into two groups at 9 developmental stages of ‘Xinyu’ pear fruit peel. Group I was highly expressed during the early fruit development stages (20DAF–60DAF) and group II was highly expressed during the later fruit development stages (70DAF–100DAF). Different colors indicate the expression levels of DEGs, from blue (low) to red (high); (B): PCA of 28,293 expression genes; and (C): cluster dendrogram of 28,293 expression genes.
Figure 6
Figure 6
The expression patterns of structural genes involved in the lignin biosynthesis pathway in the ‘Xinyu’ peel during fruit development. The heatmaps indicate the expression levels of the structural genes at different periods of fruit growth and development of the ‘Xinyu’ pear. FPKM (fragments per kilobase of transcript per million fragments mapped) is an expression unit that represents the expression level of genes in a transcriptome. The percentile value of FPKM/relative content values of structural genes ranging from low to high is represented by blue to red in the bottom left corner.
Figure 7
Figure 7
WGCNA of the DEGs identified at the different development stages of the ‘Xinyu’ pear. (A) Hierarchical clustering tree showing nine co-expressed gene modules. A total of 12,304 DEGs are clustered into branches, and each module is represented by the main tree branch. The lower panel displays the module in the specified color. (B) Module–trait correlations and the corresponding p-values are in parentheses. The left panel shows nine modules. The color scale on the right indicates the correlation of module characteristics from −1 (blue) to 1 (red). The panel labeled ‘lignin’ represents the biosynthetic properties of lignin. The other panels represent changes in gene expression levels. (C) The gene network of the hub genes in the green–yellow module, which were positively correlated with the lignin content. The correlation network diagram is divided into four layers, the two outermost genes are transcription factors, the third layer is lignin synthesis genes, and the most central layer is metabolites of lignin.
Figure 8
Figure 8
RT-qPCR analysis of eight differentially expressed structural genes and seven transcription factor genes related to lignin biosynthesis in ‘Xinyu’ pear peel during the different development stages. The bar plots illustrate the outcomes of the RT-qPCR analysis. Bars represent means ± SD (n = 3). The line graph represents the mean value of TPM for each gene from the transcriptomic data.

References

    1. Heng W.W., Yang M.D., Yang J.Y., Wang Z.T., Jiang X.H., Zhu L.W. Relationship between H2O2 in polyamine metabolism and lignin in the exocarp of a russet mutant of ‘Dangshansuli’ pear (Pyrus bretschneideri Rehd.) Plant Mol. Biol. Rep. 2016;34:1056–1063. doi: 10.1007/s11105-016-0985-z. - DOI
    1. Sun J. Discussion on the current situation and countermeasures of pear industry development in Zhejiang province. China Fruit News. 2005;21:11–13. (In Chinese)
    1. Pereira H. Chemical composition and variability of cork from Quercus suber. Wood Sci. Technol. 1988;22:211–218. doi: 10.1007/BF00386015. - DOI
    1. Lopes M.H., Barros A.S., Pascoal Neto C., Rutledge D., Delgadillo I., Gil A.M. Variability of cork from Portuguese Quercus suber studied by solid-state 13C-NMR and FTIR spectroscopie. Biopolymers. 2001;62:268–277. doi: 10.1002/bip.1022. - DOI - PubMed
    1. Shi Z.B. Ph.D. Thesis. Nanjing Agricultural University; Nanjing, China: 2011. The Mechanisms of Fruit Appearance Characters Formation in Sand Pear. (In Chinese)

LinkOut - more resources