. 2024 Jun 28;16(13):1849.
doi: 10.3390/polym16131849.

Nanoindentation Response of Structural Self-Healing Epoxy Resin: A Hybrid Experimental-Simulation Approach

Affiliations

Nanoindentation Response of Structural Self-Healing Epoxy Resin: A Hybrid Experimental-Simulation Approach

Giovanni Spinelli et al. Polymers (Basel). .

Abstract

In recent years, self-healing polymers have emerged as a topic of considerable interest owing to their capability to partially restore material properties and thereby extend the product's lifespan. The main purpose of this study is to investigate the nanoindentation response in terms of hardness, reduced modulus, contact depth, and coefficient of friction of a self-healing resin developed for use in aeronautical and aerospace contexts. To achieve this, the bifunctional epoxy precursor underwent tailored functionalization to improve its toughness, facilitating effective compatibilization with a rubber phase dispersed within the host epoxy resin. This approach aimed to highlight the significant impact of the quantity and distribution of rubber domains within the resin on enhancing its mechanical properties. The main results are that pure resin (EP sample) exhibits a higher hardness (about 36.7% more) and reduced modulus (about 7% more), consequently leading to a lower contact depth and coefficient of friction (11.4% less) compared to other formulations that, conversely, are well-suited for preserving damage from mechanical stresses due to their capabilities in absorbing mechanical energy. Furthermore, finite element method (FEM) simulations of the nanoindentation process were conducted. The numerical results were meticulously compared with experimental data, demonstrating good agreement. The simulation study confirms that the EP sample with higher hardness and reduced modulus shows less penetration depth under the same applied load with respect to the other analyzed samples. Values of 877 nm (close to the experimental result of 876.1 nm) and 1010 nm (close to the experimental result of 1008.8 nm) were calculated for EP and the toughened self-healing sample (EP-R-160-T), respectively. The numerical results of the hardness provide a value of 0.42 GPa and 0.32 GPa for EP and EP-R-160-T, respectively, which match the experimental data of 0.41 GPa and 0.30 GPa. This validation of the FEM model underscores its efficacy in predicting the mechanical behavior of nanocomposite materials under nanoindentation. The proposed investigation aims to contribute knowledge and optimization tips about self-healing resins.

Keywords: epoxy resin; mechanical properties; nanoindentation; self-healing.


Conflict of interest statement

The authors declare no conflicts of interest.

Figures

Figure 1
Figure 1
Chemical formulas of the precursor, toughening agent, and hardener agent, from left to right, respectively.
Figure 2
Figure 2
Chemical structure of molecules acting as self-healing filler.
Figure 3
Figure 3
Nanomechanical test system for innovative material characterization.
Figure 4
Figure 4
Optical images of XPM nanoindentation test trace made on the surface of (a) EP-R, (b) EP-R-160, (c) EP-R-160-DBA, (d) EP-R-160-M, and (e) EP-R-160-T. Schematic representation of the indentation matrix in (f).
Figure 5
Figure 5
(a) Graphic illustration of the simulated case study. (b) Crucial model definitions selected for the numerical analysis.
Figure 6
Figure 6
Cad images in (a) and geometrical details of the Berkovich’s indenter tip in (b).
Figure 7
Figure 7
SEM images of the samples EP-R-160-DBA (a), EP-R-160-M (b), and EP-R-160-T (c); rubber domains diameter distribution of EP-R-160-DBA (d), EP-R-160-M (e), and EP-R-160-T (f).
Figure 8
Figure 8
Hardness (a), reduced modulus (b), and contact depth (c) obtained after the XPM nanoindentation at the max force of 8000 μN; coefficient of friction (COF) at scratch (d) after nanoscratch at 1500 μN constant load.
Figure 9
Figure 9
Friction (LF/NF) over time at scratch for (a) EP-R and (b) EP-R-160-T samples.
Figure 10
Figure 10
Trapezoidal load function applied for the nanomechanical characterization in (a) force vs. displacement curves after accelerated nanomechanical property mapping XPM of all investigated samples in (b).
Figure 11
Figure 11
DMA curves for unmodified epoxy sample (EP) and rubber-functionalized specimen (EP-R-160): (a) Tan δ vs. temperature; (b) storage modulus vs. temperature.
Figure 12
Figure 12
XPM plots of (a) EP-R, (b) EP-R-160, (c) EP-R-160-DBA, (d) EP-R-160-M, and (e) EP-R-160-T samples.
Figure 12
Figure 12
XPM plots of (a) EP-R, (b) EP-R-160, (c) EP-R-160-DBA, (d) EP-R-160-M, and (e) EP-R-160-T samples.
Figure 13
Figure 13
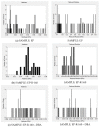
XPM histogram plots of (a) EP, (b) EP-R, (c) EP-R-160-DBA, (d) EP-R-160-M, and (e) EP-R-160-T samples.
Figure 13
Figure 13
XPM histogram plots of (a) EP, (b) EP-R, (c) EP-R-160-DBA, (d) EP-R-160-M, and (e) EP-R-160-T samples.
Figure 14
Figure 14
(ae) Two-dimensional SPM images of XPM (left parts) and three-dimensional SPM images of XPM (right parts) of nanoindentation test trace made on the surface of (a) EP-R, (b) EP-R-160, (c) EP-R-160-DBA, (d) EP-R-160-M, (e) EP-R-160-T, and (e) samples.
Figure 15
Figure 15
(ac) Two-dimensional SPM images (first row) and three-dimensional SPM images (second row) of nanoscratch trace scanned over a 20 μm × 20 μm surface area of (a) EP-R, (b) EP-R-160-DBA, and (c) EP-R-160-T samples.
Figure 16
Figure 16
z-axis displacement versus the entire time interval for the EP sample in (a) and the EP-R-160-T sample in (b).
Figure 17
Figure 17
Time instances and corresponding loads selected for particular numerical insights in (a); resting position (t = 0 s and t = 0.3 s) with no load (L = 0) for the EP and EP-R-160-T samples in (b).
Figure 18
Figure 18
Contact depth for EP sample (left) and EP-R-160-T (right) at some selected time instances during the holding phase: t = 0.025 s in (a), t = 0.05 s in (b), and t = 0.075 s in (c).
Figure 19
Figure 19
Contact depth for EP sample (a) and EP-R-160-T (b) at time instances t = 0.13 s, at which the maximum contact depth is recorded. The contour lines highlight the different indentation profiles.
Figure 20
Figure 20
z-axis displacement over time during the loading phase to evaluate the depth rate of the samples.
Figure 21
Figure 21
z-axis displacement versus thickness at some selected instants of time for (a) EP-R and (b) EP-R-160-T samples.
Figure 22
Figure 22
Indentation imprint at maximum contact depth for assessing projected areas (Aproj). A 3D view in (a,b) for EP and EP-R-160-T sample and corresponding 2D top view in 2D view in (c,d).
Figure 23
Figure 23
(a,b) Deformation contours for EP-R and EP-R-160-T samples in (a) and (b), respectively.
Figure 24
Figure 24
Von Mises stress (average value) for EP-R and EP-R-160-T samples evaluated on the entire domain in (a) and upper surfaces of the samples in (b), respectively.
Figure 25
Figure 25
Three-dimensional sectional view of von Mises stress recorded at the time instant t = 0.13 s for EP-R and EP-R-160-T in (a) and (b), respectively.
Figure 26
Figure 26
Von Mises stress recorded at the time instant t = 0.13 s for EP-R and EP-R-160-T in a 3D view and top view in (a) and (b), respectively.

References

    1. Branda F., Parida D., Pauer R., Durante M., Gaan S., Malucelli G., Bifulco A. Effect of the Coupling Agent (3-Aminopropyl) Triethoxysilane on the Structure and Fire Behavior of Solvent-Free One-Pot Synthesized Silica-Epoxy Nanocomposites. Polymers. 2022;14:3853. doi: 10.3390/polym14183853. - DOI - PMC - PubMed
    1. Bifulco A., Marotta A., Passaro J., Costantini A., Cerruti P., Gentile G., Ambrogi V., Malucelli G., Branda F. Thermal and Fire Behavior of a Bio-Based Epoxy/Silica Hybrid Cured with Methyl Nadic Anhydride. Polymers. 2020;12:1661. doi: 10.3390/polym12081661. - DOI - PMC - PubMed
    1. Passaro J., Bifulco A., Calabrese E., Imparato C., Raimondo M., Pantani R., Aronne A., Guadagno L. Hybrid Hemp Particles as Functional Fillers for the Manufacturing of Hydrophobic and Anti-Icing Epoxy Composite Coatings. ACS Omega. 2023;8:23596–23606. doi: 10.1021/acsomega.3c01415. - DOI - PMC - PubMed
    1. Righi C., Barbieri F., Sgarbi E., Maistrello L., Bertacchini A., Andreola F.N., D’angelo A., Catauro M., Barbieri L. Suitability of Porous Inorganic Materials from Industrial Residues and Bioproducts for Use in Horticulture: A Multidisciplinary Approach. Appl. Sci. 2022;12:5437. doi: 10.3390/app12115437. - DOI
    1. Vertuccio L., Guadagno L., D’Angelo A., Viola V., Raimondo M., Catauro M. Sol-Gel Synthesis of Caffeic Acid Entrapped in Silica/Polyethylene Glycol Based Organic-Inorganic Hybrids: Drug Delivery and Biological Properties. Appl. Sci. 2023;13:2164. doi: 10.3390/app13042164. - DOI

LinkOut - more resources