. 2024 Jul 6;16(13):1933.
doi: 10.3390/polym16131933.

Novel Optical Methodology Unveils the Impact of a Polymeric Pour-Point Depressant on the Phase Morphology of Waxy Crude Oils

Affiliations

Novel Optical Methodology Unveils the Impact of a Polymeric Pour-Point Depressant on the Phase Morphology of Waxy Crude Oils

Irene Perna et al. Polymers (Basel). .

Abstract

Crude oil, also known as petroleum, plays a crucial role in global economies, politics, and technological advancements due to its widespread applications in industrial organic chemistry. Despite environmental concerns, the dwindling supply of easily accessible oil reservoirs necessitates the exploration of unconventional resources, such as heavy and extra-heavy oils. These oils, characterized by high viscosity and complex composition, pose challenges in extraction, transportation, and refinement. With decreasing temperatures, heavy oils undergo phase changes, with transitions from Newtonian to non-Newtonian fluid behavior, leading to difficulties in transportation. Alternative methods, such as the use of polymeric pour-point depressants, help mitigate flowability issues by preventing wax precipitation. Understanding the properties of waxy crude oil, such as the wax appearance temperature (WAT), is crucial for effective mitigation strategies. The objective of this research is to determine the WATs of different types of waxy crude oils through a comparative analysis using advanced techniques such as cross-polar microscopy (CPM), standard rheology, and differential scanning calorimetry (DSC). Disparities in WAT identified through different analytical methods highlight the potential of microscopy to enhance our understanding of complex fluid dynamics in real time in order to proactively identify and address crystallization issues in oilfields.

Keywords: flow assurance; phase morphology; polymeric pour point depressants; waxy crude oils.


Conflict of interest statement

Author Rosalia Ferraro and Sergio Caserta were employed by the company CEINGE Advanced Biotechnologies Franco Salvatore, and Author Salvatore Coppola was employed by the company Versalis S.p.A. (Eni). The remaining authors declare that the research was conducted in the absence of any commercial or financial relationships that could be construed as a potential conflict of interest.

Figures

Figure 1
Figure 1
The imposed thermal profile initiates with a rapid cooling phase from 30 °C to 4 °C (points 1–2), followed by a 10 min isothermal hold at 4 °C (points 2–3). Subsequently, a controlled heating phase from 4 °C to 50 °C (points 3–4) is executed, succeeded by a controlled cooling phase from 50 °C back to 4 °C (points 4–5). Another 10 min isothermal hold at 4 °C follows (points 5–6) before the profile concludes with a second controlled heating phase from 4 °C to 50 °C (points 6–7). The heating and cooling rates were maintained at a constant 1 °C per minute.
Figure 2
Figure 2
Cumulative heat flow versus temperature, T, for samples B, C, D, and E in (a), (b), (c), and (d), respectively. The imposed thermal profile follows the following previously defined code: points 1–2 for the first cooling ramp, points 2–3 for a 10 min holding period at a specified temperature, points 3–4 for the first heating ramp, points 4–5 for the second cooling ramp, points 5–6 for another 10 min holding period at 4 °C, and points 6–7 for the second heating ramp. The red lines indicate the heating phase, while the blue lines denote the cooling phase of the imposed thermal profile. Arrows with the same color code are added to help visualize the thermal cycle.
Figure 3
Figure 3
Elastic modulus, G′, versus temperature, T, highlighting the effects of paraffin concentration (a) for samples B, C, and D, extraction time (b) for samples E and F, and PPD percentage (c) for samples E, F, and H. The imposed thermal profile follows the following previously defined code: points 12 for the first cooling ramp, points 23 for a 10 min holding period at a specified temperature, points 3–4 for the first heating ramp, points 4–5 for the second cooling ramp, points 5–6 for another 10 min holding period at 4 °C, and points 6–7 for the second heating ramp. Blue downward triangle symbols represent cooling, while red upward triangle symbols represent heating, distinguished by filled and empty symbols for the first and second cycles, respectively.
Figure 4
Figure 4
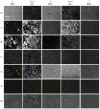
Representative phase-contrast microscopy images of samples B, C, D, E, F, G and H, arranged in rows, captured at different temperatures, arranged in columns, according to the temperature history previously described and reported in Figure 1. Specifically, point 1 defined the beginning of the test at 30 °C, point 2 = 3 involved a 10 min holding temperature of 4 °C, point 4 involved a heating ramp at 50 °C, point 5 = 6 involved a 10 min holding temperature of 4 °C, and point 7 marked the conclusion of the test at 50 °C. Yellow arrows are shown to highlight the crystalline structures.
Figure 5
Figure 5
The mean intensity of light (I), normalized with respect to the value at time zero (I0) for each sample, versus temperature T. The data allow the identification of the effect of paraffin concentration (a) for samples B, C, and D, extraction time (b) for samples E and F, and PPD percentage (c) for samples E, F, and H. The imposed thermal profile follows the following previously defined code: points 12 for the first cooling ramp, points 23 for a 10 min holding period at a specified temperature, points 34 for the first heating ramp, points 45 for the second cooling ramp, points 56 for another 10 min holding period at 4 °C, and points 67 for the second heating ramp. Blue downward triangle symbols represent cooling, while red upward triangle symbols represent heating, distinguished by filled and empty symbols for the first and second cycle, respectively. The maximum percentage error is 15.38%.
Figure 6
Figure 6
Comparison of the WATs obtained for all samples investigated during the first and second cycles, referred to as WAT1 (a) and WAT2 (b), using three approaches: differential scanning calorimetry (DSC), rheology, and contact profilometry (CPM). The maximum percentage error evaluated in the WAT2 data with respect to the microscopy results is 5.32%.

References

    1. Vassiliou M.S. Historical Dictionary of the Petroleum Industry. Rowman & Littlefield; Lanham, MD, USA: 2018.
    1. Martínez-Palou R., Mosqueira M.d.L., Zapata-Rendón B., Mar-Juárez E., Bernal-Huicochea C., de la Cruz Clavel-López J., Aburto J. Transportation of heavy and extra-heavy crude oil by pipeline: A review. J. Pet. Sci. Eng. 2011;75:274–282. doi: 10.1016/j.petrol.2010.11.020. - DOI
    1. Yadav V.G., Yadav G.D., Patankar S.C. The production of fuels and chemicals in the new world: Critical analysis of the choice between crude oil and biomass vis-à-vis sustainability and the environment. Clean Technol. Environ. Policy. 2020;22:1757–1774. doi: 10.1007/s10098-020-01945-5. - DOI - PMC - PubMed
    1. Suliman M.A., Olarewaju T.A., Basheer C., Lee H.K. Microextraction and its application for petroleum and crude oil samples. J. Chromatogr. A. 2021;1636:461795. doi: 10.1016/j.chroma.2020.461795. - DOI - PubMed
    1. Sena M.F.M.d., Rosa L.P., Szklo A. Will Venezuelan extra-heavy oil be a significant source of petroleum in the next decades? Energy Policy. 2013;61:51–59. doi: 10.1016/j.enpol.2013.05.101. - DOI

LinkOut - more resources