. 2024 Jul 2;24(13):4312.
doi: 10.3390/s24134312.

Distinguishing between Wheat Grains Infested by Four Fusarium Species by Measuring with a Low-Cost Electronic Nose

Affiliations

Distinguishing between Wheat Grains Infested by Four Fusarium Species by Measuring with a Low-Cost Electronic Nose

Piotr Borowik et al. Sensors (Basel). .

Abstract

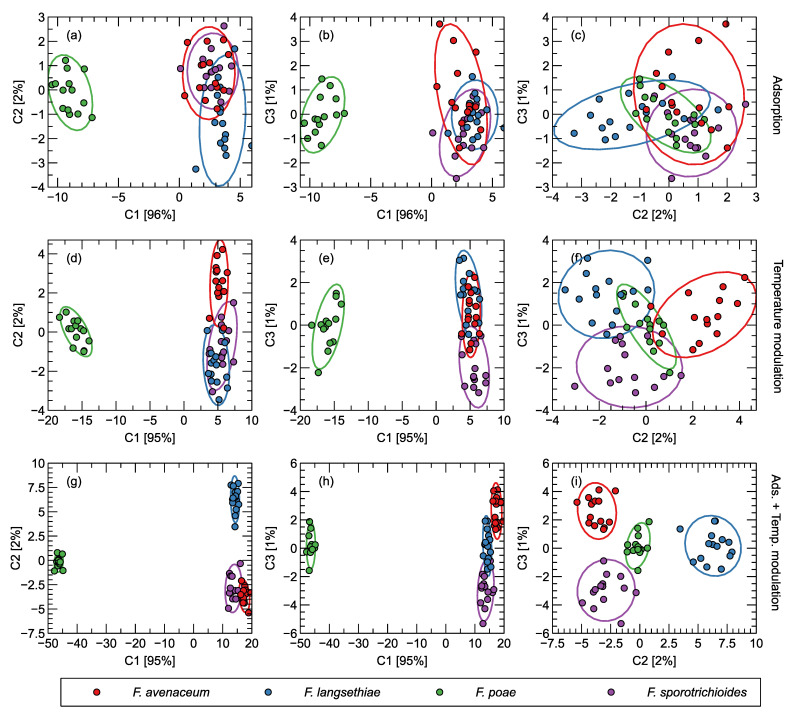
An electronic device based on the detection of volatile substances was developed in response to the need to distinguish between fungal infestations in food and was applied to wheat grains. The most common pathogens belong to the fungi of the genus Fusarium: F. avenaceum, F. langsethiae, F. poae, and F. sporotrichioides. The electronic nose prototype is a low-cost device based on commercially available TGS series sensors from Figaro Corp. Two types of gas sensors that respond to the perturbation are used to collect signals useful for discriminating between the samples under study. First, an electronic nose detects the transient response of the sensors to a change in operating conditions from clean air to the presence of the gas being measured. A simple gas chamber was used to create a sudden change in gas composition near the sensors. An inexpensive pneumatic system consisting of a pump and a carbon filter was used to supply the system with clean air. It was also used to clean the sensors between measurement cycles. The second function of the electronic nose is to detect the response of the sensor to temperature disturbances of the sensor heater in the presence of the gas to be measured. It has been shown that features extracted from the transient response of the sensor to perturbations by modulating the temperature of the sensor heater resulted in better classification performance than when the machine learning model was built from features extracted from the response of the sensor in the gas adsorption phase. By combining features from both phases of the sensor response, a further improvement in classification performance was achieved. The E-nose enabled the differentiation of F. poae from the other fungal species tested with excellent performance. The overall classification rate using the Support Vector Machine model reached 70 per cent between the four fungal categories tested.

Keywords: Fusarium avenaceum; Fusarium langsethiae; Fusarium poae; Fusarium sporotrichioides; application of e-nose; gas sensor.


Conflict of interest statement

The authors declare no conflicts of interest.

Figures

Figure A1
Figure A1
Chemical compounds detected by the GC-MS analysis [56]. The numbers (rounded to whole percentages) indicate the percent of the total ion current collected during the measurement of a sample. The bars are plotted to facilitate visual comparison of data. Empty cells in the table indicate that the component has not been detected, and zero indicates that the found percentage of the detected compounds in the sample was below one percent.
Figure A2
Figure A2
Principal Components Analysis transformation of the proportion of chemical compounds identified in the GC-MS analysis of measured samples. The sub-figure columns represent different projections onto the PCA components, as indicated in the axis labels. The variability explained by the components is indicated in the axis labels. Confidence ellipses for two standard deviations are shown.
Figure 1
Figure 1
Measurement setup of the electronic nose. (1)—sensor chamber, (2)—control unit, (3)—measured sample in a Petri dish, (4)—charcoal air filter, (5)—laptop controlling the measurements.
Figure 2
Figure 2
Examples of shapes of sensor electronic nose response during one measurement cycle of a sample. (blue)—the shape of the response of the TGS 2602 sensor, (green)—the shape of the response of all other types of used sensors (Table 1). Various stages of the measurement cycle are indicated inside the figure. The red dot at the beginning of the gas adsorption phase and at the beginning of the sensor temperature modulation phase represent the baseline response level, which is different for each of the response phases.
Figure 3
Figure 3
(ai) Distribution of observations obtained by electronic nose measurements as LDA projection of features extracted from sensor response curves. The rows of the sub-figures represent different sets of features: extracted from the adsorption phase, extracted from the temperature modulation phase, and extracted from both phases of the response, as indicated on the right side of the figure. The columns of the sub-figures represent different projections onto the LDA components c1–c2, c1–c3, and c2–c3, as indicated at the top of the figure and in the axis labels. The percentage of variance explained by the selected components is indicated in the axis labels. Confidence ellipses for two standard deviations are shown.
Figure 4
Figure 4
Measures of the performance of classification models obtained by Logistic Regression and Support Vector Machine algorithms estimated with the leave-one-out cross-validation method. (a) Accuracy, (b) Precision, (c) Recall, as indicated in y-axis captions. Comparison of different sets of predictors extracted from the adsorption phase (A), the temperature modulation phase (T), both phases of the sensor response (AT). For Precision and Recall, the average of the performance for all species is compared with the performance of F. poae alone. The numerical values of the metrics with corresponding confidence intervals are presented in Table 4.

Similar articles

Cited by

References

    1. Focker M., van der Fels-Klerx H., Magan N., Edwards S., Grahovac M., Bagi F., Budakov D., Suman M., Schatzmayr G., Krska R., et al. The impact of management practices to prevent and control mycotoxins in the European food supply chain: MyToolBox project results. World Mycotoxin J. 2021;14:139–154. doi: 10.3920/WMJ2020.2588. - DOI
    1. Osborne L.E., Stein J.M. Epidemiology of Fusarium head blight on small-grain cereals. Int. J. Food Microbiol. 2007;119:103–108. doi: 10.1016/j.ijfoodmicro.2007.07.032. - DOI - PubMed
    1. Okorski A., Milewska A., Pszczółkowska A., Karpiesiuk K., Kozera W., Dąbrowska J.A., Radwińska J. Prevalence of Fusarium fungi and Deoxynivalenol Levels in Winter Wheat Grain in Different Climatic Regions of Poland. Toxins. 2022;14:102. doi: 10.3390/toxins14020102. - DOI - PMC - PubMed
    1. Yin Y., Liu X., Ma Z. Simultaneous detection of Fusarium asiaticum and Fusarium graminearumin wheat seeds using a real-time PCR method. Lett. Appl. Microbiol. 2009;48:680–686. doi: 10.1111/j.1472-765x.2009.02595.x. - DOI - PubMed
    1. Persaud K., Dodd G. Analysis of discrimination mechanisms in the mammalian olfactory system using a model nose. Nature. 1982;299:352–355. doi: 10.1038/299352a0. - DOI - PubMed

MeSH terms

Substances

LinkOut - more resources