. 2024 Jun 29;14(13):1392.
doi: 10.3390/diagnostics14131392.

The Impact of Laboratory Automation on the Time to Urine Microbiological Results: A Five-Year Retrospective Study

Affiliations

The Impact of Laboratory Automation on the Time to Urine Microbiological Results: A Five-Year Retrospective Study

Antonios Kritikos et al. Diagnostics (Basel). .

Abstract

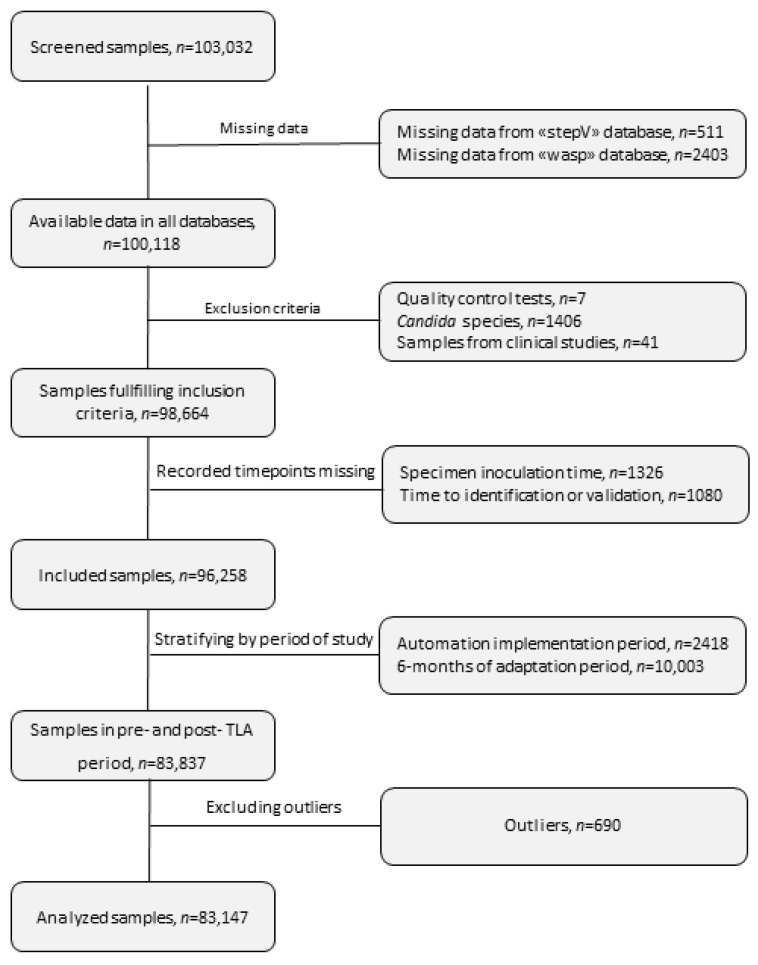
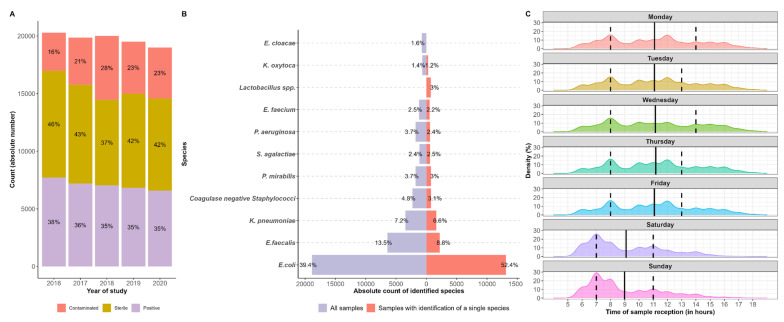
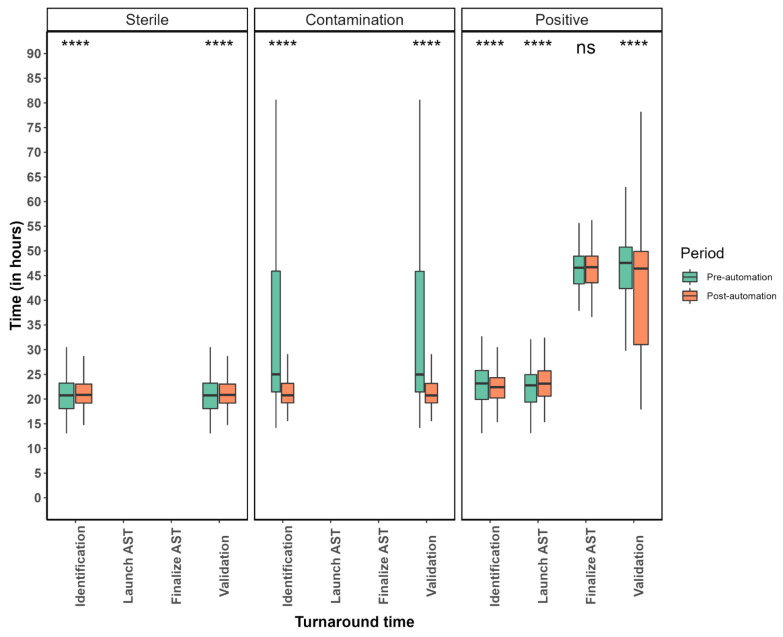
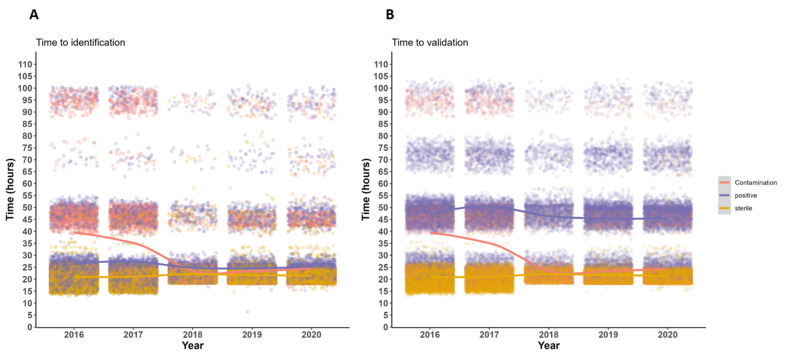
Total laboratory automation (TLA) is a valuable component of microbiology laboratories and a growing number of publications suggest the potential impact of automation in terms of analysis standardization, streaking quality, and the turnaround time (TAT). The aim of this project was to perform a detailed investigation of the impact of TLA on the workflow of commonly treated specimens such as urine. This is a retrospective observational study comparing two time periods (pre TLA versus post TLA) for urine specimen culture processing. A total of 35,864 urine specimens were plated during the pre-TLA period and 47,283 were plated during the post-TLA period. The median time from streaking to identification decreased from 22.3 h pre TLA to 21.4 h post TLA (p < 0.001), and the median time from streaking to final validation of the report decreased from 24.3 h pre TLA to 23 h post TLA (p < 0.001). Further analysis revealed that the observed differences in TAT were mainly driven by the contaminated and positive samples. Our findings demonstrate that TLA has the potential to decrease turnaround times of samples in a laboratory. Nevertheless, changes in laboratory workflow (such as extended opening hours for plate reading and antibiotic susceptibility testing or decreased incubation times) might further maximize the efficiency of TLA and optimize TATs.

Keywords: laboratory automation; time to results; total automation; turnaround time; urine cultures.


Conflict of interest statement

Antonios Kritikos’s salary was partially covered by a research grant on automation from Becton Dickinson Company. Funding for this project was also partially covered by the R&D budget of the Institute of Microbiology of the University of Lausanne. Guy Prod’hom has no conflicts of interest to declare. Damien Jacot reports receiving grants from Becton Dickinson during the execution of this study and outside the submitted work. Antony Croxatto reports receiving a grant from Becton Dickinson during the execution of this study and outside the submitted work. Gilbert Greub received a Becton Dickinson research grant that covered the salary of the first author (A.K.) as a part of his MD-PhD thesis. The salary of a lab technician within the diagnostic laboratory was also supported by the same grant. However, this article was not reviewed by Becton Dickinson, and according to the research agreement, we in the microbiology laboratory in Lausanne were fully free to comment on the limitations of automation in reducing the time to results.

Figures

Figure 1
Figure 1
Urine culture workflow and turnaround times captured during the study period.
Figure 2
Figure 2
Flowchart of included samples. Three databases were investigated for this project, namely “Infoculture”, “Wasp”, and “StepV”. The Infoculture database provided the samples for screening, as well as information on epidemiological and microbiological data. The Wasp database contained information regarding the samples’ inoculation times, and the StepV database contained information on consecutive steps of the workflow until the final validation of the result.
Figure 3
Figure 3
Demographics of specimens included in the study. (A) Results of urine specimens included in the study. (B) Distribution of microorganisms isolated from patient urine cultures. (C) Density plots showing the daily distribution of urine samples (workload) throughout the week. (Solid black lines represent mean values and dashed lines represent the interquartile range (IQR).)
Figure 4
Figure 4
Density plots of TAT distribution during the two study periods. Panel (A) shows the TAT distribution on the pre-automation period and panel (B) on the post-automation period. The colored density plots show TATs from weekday samples, while the superimposed grey-colored plots show all samples combined (weekend included). The black and grey-colored dashed lines show the median TATs from the weekday samples vs. all samples included, respectively.
Figure 5
Figure 5
Boxplots of TATs stratified by the specimen result and study period. ns: non-significant, **** = p < 0.0001.
Figure 6
Figure 6
Scatterplot of TATs until identification and until final validation throughout the study period. Panel (A) shows the time until identification and panel (B) the time until final validation. Each dot represents one observation (one analyzed sample). The smooth colored lines show the general trends over time.

Similar articles

Cited by

References

    1. Burckhardt I. Laboratory Automation in Clinical Microbiology. Bioengineering. 2018;5:102. doi: 10.3390/bioengineering5040102. - DOI - PMC - PubMed
    1. Novak S.M., Marlowe E.M. Automation in the clinical microbiology laboratory. Clin. Lab. Med. 2013;33:567–588. doi: 10.1016/j.cll.2013.03.002. - DOI - PubMed
    1. Antonios K., Croxatto A., Culbreath K. Current State of Laboratory Automation in Clinical Microbiology Laboratory. Clin. Chem. 2021;68:99–114. doi: 10.1093/clinchem/hvab242. - DOI - PubMed
    1. Bailey A.L., Ledeboer N., Burnham C.D. Clinical Microbiology Is Growing Up: The Total Laboratory Automation Revolution. Clin. Chem. 2019;65:634–643. doi: 10.1373/clinchem.2017.274522. - DOI - PubMed
    1. Dauwalder O., Landrieve L., Laurent F., de Montclos M., Vandenesch F., Lina G. Does bacteriology laboratory automation reduce time to results and increase quality management? Clin. Microbiol. Infect. 2016;22:236–243. doi: 10.1016/j.cmi.2015.10.037. - DOI - PubMed

LinkOut - more resources