

Identification of miRNAs Present in Cell- and Plasma-Derived Extracellular Vesicles-Possible Biomarkers of Colorectal Cancer
- PMID: 39001526
- PMCID: PMC11240749
- DOI: 10.3390/cancers16132464
Identification of miRNAs Present in Cell- and Plasma-Derived Extracellular Vesicles-Possible Biomarkers of Colorectal Cancer
Abstract
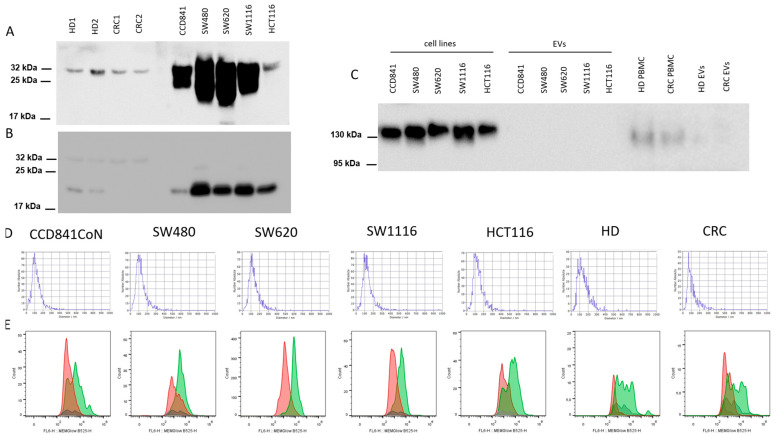
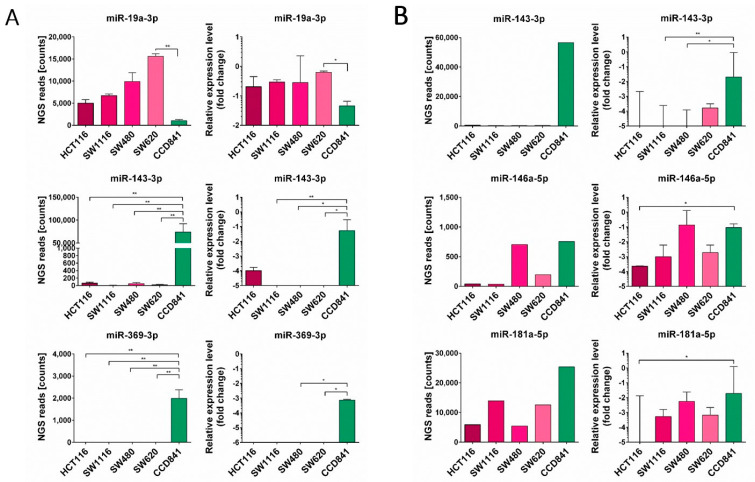
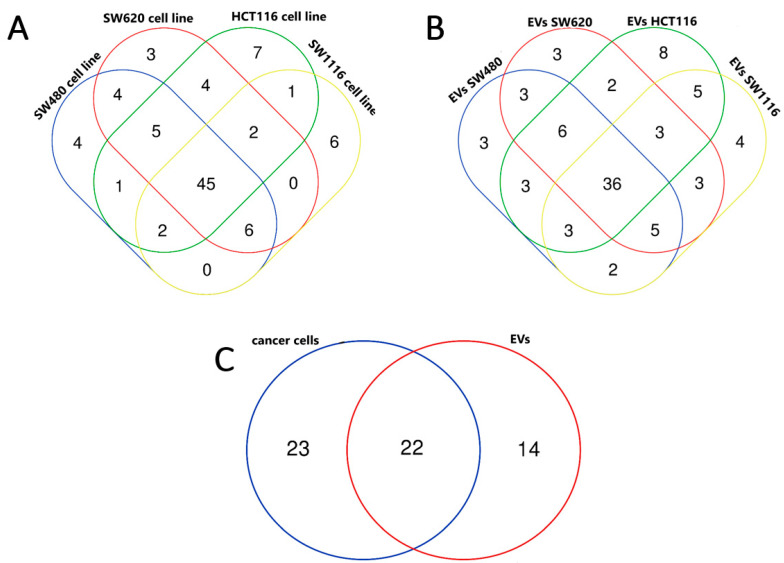
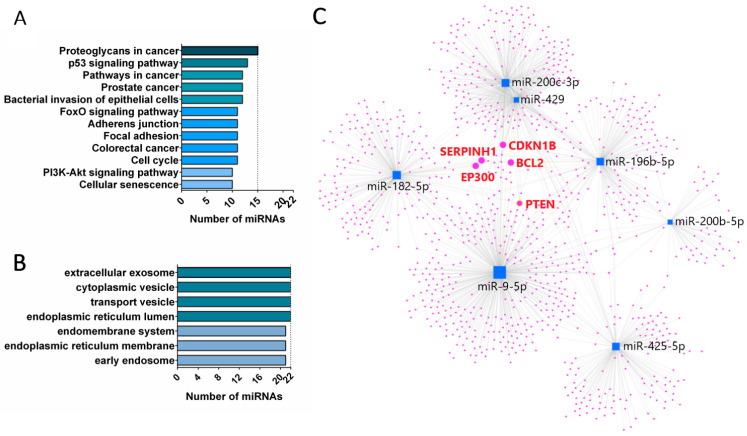
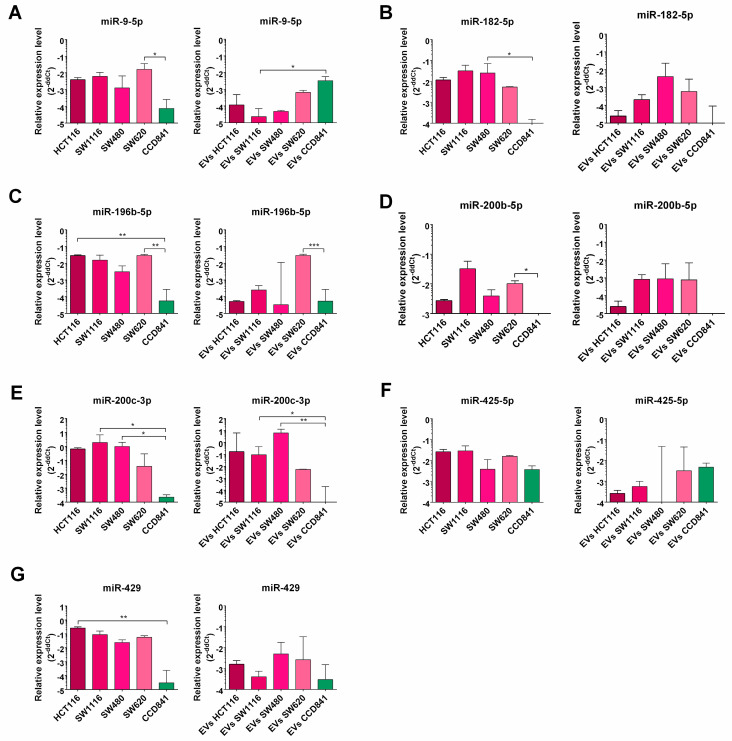
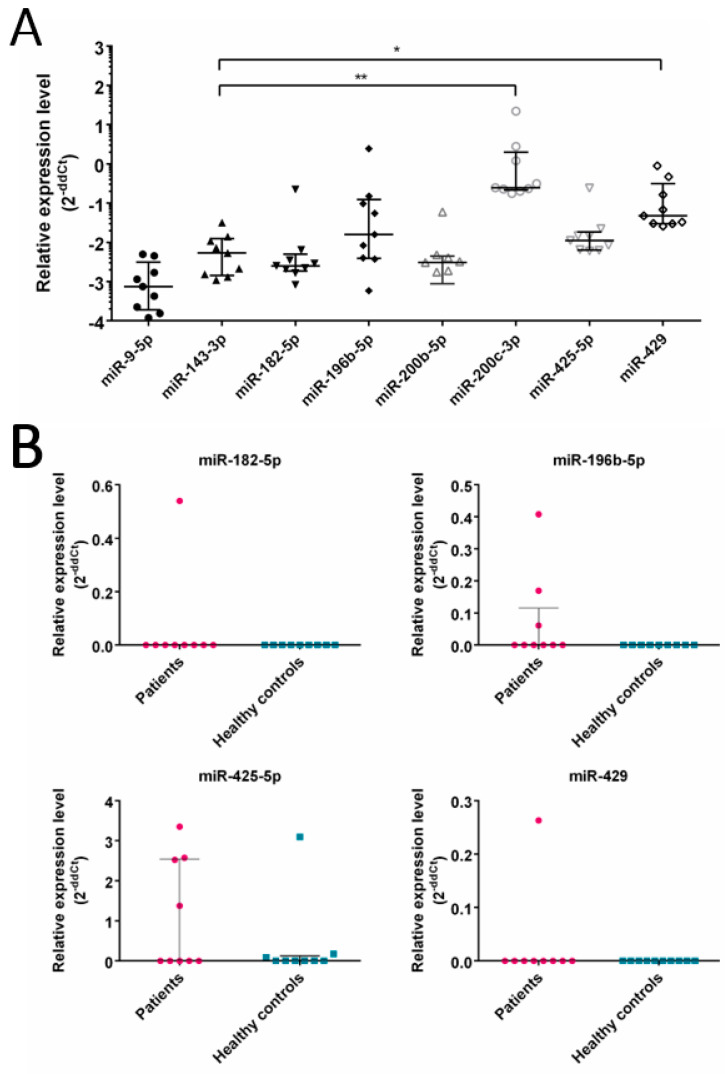
Globally, an increasing prevalence of colorectal cancer (CRC) prompts a need for the development of new methods for early tumor detection. MicroRNAs (also referred to as miRNAs) are short non-coding RNA molecules that play a pivotal role in the regulation of gene expression. MiRNAs are effectively transferred to extracellular vesicle (EVs) membrane sacs commonly released by cells. Our study aimed to examine the expression of miRNAs in four CRC cell lines and EVs derived from them (tumor EVs) in comparison to the normal colon epithelium cell line and its EVs. EVs were isolated by ultracentrifugation from the culture supernatant of SW480, SW620, SW1116, HCT116 and normal CCD841CoN cell lines and characterized according to the MISEV2023 guidelines. MiRNAs were analyzed by small RNA sequencing and validated by quantitative PCR. The performed analysis revealed 22 common miRNAs highly expressed in CRC cell lines and effectively transferred to tumor EVs, including miR-9-5p, miR-182-5p, miR-196b-5p, miR-200b-5p, miR-200c-3p, miR-425-5p and miR-429, which are associated with development, proliferation, invasion and migration of colorectal cancer cells, as well as in vesicle maturation and transport-associated pathways. In parallel, normal cells expressed miRNAs, such as miR-369 and miR-143, which play a role in proinflammatory response and tumor suppression. The analysis of selected miRNAs in plasma-derived EVs and tumor samples from CRC patients showed the similarity of miRNA expression profile between the patients' samples and CRC cell lines. Moreover, miR-182-5p, miR-196-5p, miR-425-5p and miR-429 were detected in several EV samples isolated from patients' plasma. Our results suggest that miR-182-5p, miR-196b-5p and miR-429 are differentially expressed between EVs from CRC patients and healthy donors, which might have clinical implications.
Keywords: colorectal cancer; colorectal cancer cell lines; miRNA expression profile; miRNAs; tumor-derived extracellular vesicles.
Conflict of interest statement
The authors declare no conflicts of interest.
Figures
Similar articles
-
SIV Infection Regulates Compartmentalization of Circulating Blood Plasma miRNAs within Extracellular Vesicles (EVs) and Extracellular Condensates (ECs) and Decreases EV-Associated miRNA-128.Viruses. 2023 Feb 24;15(3):622. doi: 10.3390/v15030622. Viruses. 2023. PMID: 36992331 Free PMC article.
-
Alterations in Abundance and Compartmentalization of miRNAs in Blood Plasma Extracellular Vesicles and Extracellular Condensates during HIV/SIV Infection and Its Modulation by Antiretroviral Therapy (ART) and Delta-9-Tetrahydrocannabinol (Δ9-THC).Viruses. 2023 Feb 24;15(3):623. doi: 10.3390/v15030623. Viruses. 2023. PMID: 36992332 Free PMC article.
-
Colorectal cancer cell-derived extracellular vesicles transfer miR-221-3p to promote endothelial cell angiogenesis via targeting suppressor of cytokine signaling 3.Life Sci. 2021 Nov 15;285:119937. doi: 10.1016/j.lfs.2021.119937. Epub 2021 Sep 8. Life Sci. 2021. PMID: 34508764
-
Extracellular Vesicles as Biomarkers of Pregnancy Complications.Int J Mol Sci. 2024 Nov 6;25(22):11944. doi: 10.3390/ijms252211944. Int J Mol Sci. 2024. PMID: 39596014 Free PMC article. Review.
-
Extracellular vesicles in tumor-adipose tissue crosstalk: key drivers and therapeutic targets in cancer cachexia.Extracell Vesicles Circ Nucl Acids. 2024 Jul 23;5(3):371-396. doi: 10.20517/evcna.2024.36. eCollection 2024. Extracell Vesicles Circ Nucl Acids. 2024. PMID: 39697630 Free PMC article. Review.
Cited by
-
Tumor-derived exosomal miR-425-5p and miR-135b-3p enhance colorectal cancer progression through immune suppression and vascular permeability promotion.World J Gastrointest Oncol. 2025 Jun 15;17(6):106161. doi: 10.4251/wjgo.v17.i6.106161. World J Gastrointest Oncol. 2025. PMID: 40547161 Free PMC article.
-
Extracellular Vesicles for Clinical Diagnostics: From Bulk Measurements to Single-Vesicle Analysis.ACS Nano. 2025 Aug 12;19(31):28021-28109. doi: 10.1021/acsnano.5c00706. Epub 2025 Jul 28. ACS Nano. 2025. PMID: 40720603 Free PMC article. Review.
References
-
- Papareddy P., Tapken I., Kroh K., Varma Bhongir R.K., Rahman M., Baumgarten M., Cim E.I., Györffy L., Smeds E., Neumann A., et al. The Role of Extracellular Vesicle Fusion with Target Cells in Triggering Systemic Inflammation. Nat. Commun. 2024;15:1150. doi: 10.1038/s41467-024-45125-1. - DOI - PMC - PubMed
Grants and funding
LinkOut - more resources
Full Text Sources
