. 2024 Sep 4;14(9):jkae157.
doi: 10.1093/g3journal/jkae157.

Selection with two alleles of X-linkage and its application to the fitness component analysis of OdsH in Drosophila

Affiliations

Selection with two alleles of X-linkage and its application to the fitness component analysis of OdsH in Drosophila

Sha Sun et al. G3 (Bethesda). .

Abstract

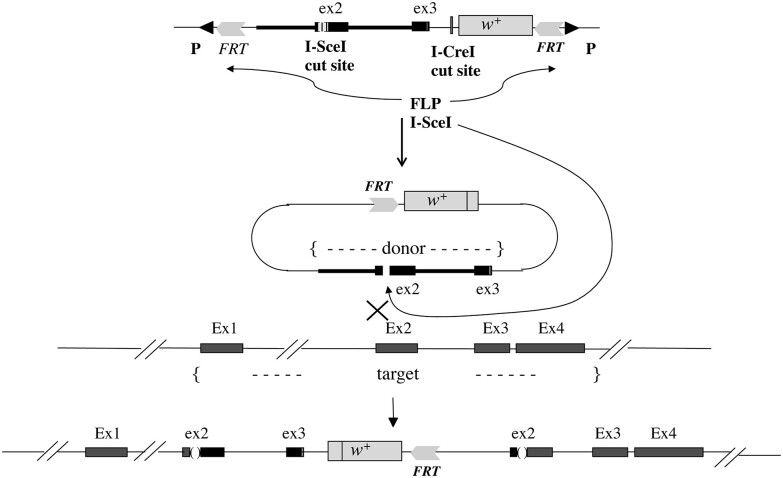
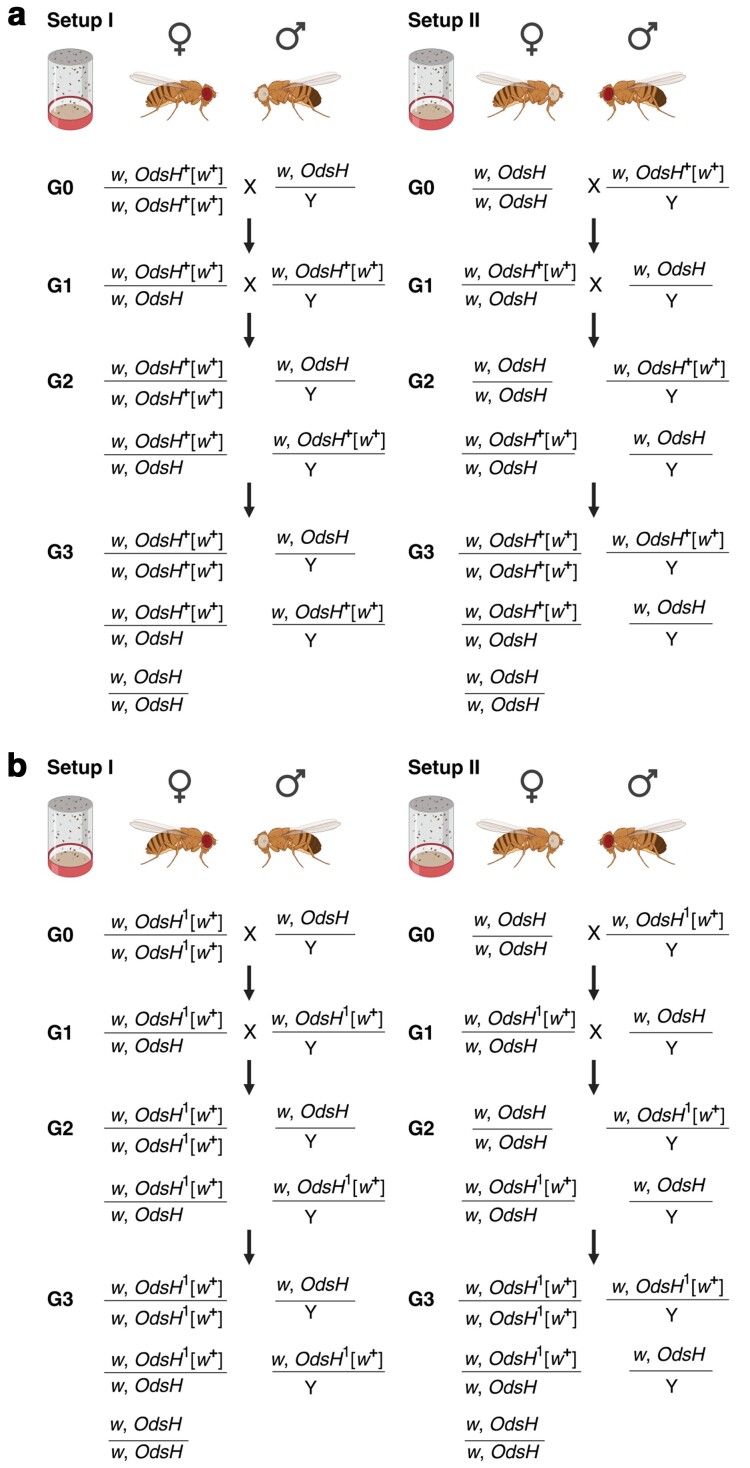
In organisms with the XY sex-determination system, there is an imbalance in the inheritance and transmission of the X chromosome between males and females. Unlike an autosomal allele, an X-linked recessive allele in a female will have phenotypic effects on its male counterpart. Thus, genes located on the X chromosome are of particular interest to researchers in molecular evolution and genetics. Here we present a model for selection with two alleles of X-linkage to understand fitness components associated with genes on the X chromosome. We apply this model to the fitness analysis of an X-linked gene, OdsH (16D), in the fruit fly Drosophila melanogaster. The function of OdsH is involved in sperm production and the gene is rapidly evolving under positive selection. Using site-directed gene targeting, we generated functional and defective OdsH variants tagged with the eye-color marker gene white. We compare the allele frequency changes of the two OdsH variants, each directly competing against a wild-type OdsH allele in concurrent but separate experimental populations. After 20 generations, the two genetically modified OdsH variants displayed a 40% difference in allele frequencies, with the functional OdsH variant demonstrating an advantage over the defective variant. Using maximum likelihood estimation, we determined the fitness components associated with the OdsH alleles in males and females. Our analysis revealed functional aspects of the fitness determinants associated with OdsH, and that sex-specific fertility and viability consequences both contribute to selection on an X-linked gene.

Keywords: OdsH; X-linkage; fitness components; selection; sex bias; two alleles.


Conflict of interest statement

Conflicts of interest The authors declare no conflicts of interest.

Figures

Fig. 1.
Fig. 1.
Gene targeting at OdsH. The targeting construct (top) contains the direct repeats of the recombination target (FRT) in a P-element, which carries a homologous genomic fragment of OdsH Exon 2 and partial Exon 3 (ex3) with the marker gene white (w+). The constructed Exon 2 (ex2) contains a restriction enzyme recognition site for I-SceI. Heat-shock-induced FLP enzyme in the transgenic flies will cause the excision of the FRT-flanked donor DNA, followed by restriction digest induced by the I-SceI enzyme synthesized in these flies resulting in a double-strand break in ex2. In accordance with the double-strand DNA break repair mechanism, homologous recombination between the donor and the endogenous OdsH will result in the integration of the donor DNA into the OdsH locus with the endogenous Exon 1 (Ex1), Exon 2 (Ex2), Exon 3 (Ex3), and Exon 4 (Ex4). A mutation resulting from an imprecise integration could affect the gene structure and function of OdsH.
Fig. 2.
Fig. 2.
DNA fluorescent in situ hybridization (FISH) of a polytene chromosome. Chromosome X from a transgenic male fly with modified OdsH is identified by DNA FISH against the marker gene white in polytene chromosomes. A digoxigenin (DIG) labeled white DNA probe was detected with anti-DIG rhodamine conjugate (red) at cytological positions 3C (arrow corresponding to the endogenous white(w) gene locus) and 16D (arrow corresponding to the endogenous OdsH gene locus). Polytene chromosomes with compacted bands are visualized by DAPI staining (blue).
Fig. 3.
Fig. 3.
Southern blotting of the genomic DNA isolated from transgenic flies. Insertion of the donor DNA at OdsH is validated by genomic DNA size increase detected by a DIG labeled OdsH probe on genomic DNA digested by restriction enzyme EcoR I or BamH I. Six OdsH transgenic lines (#1, #2, #3, #4, #5, and #6) from independent gene modification events were compared with two wild-type (w) control lines.
Fig. 4.
Fig. 4.
RNA reverse transcription (RT)-PCR and genomic long-template PCR on OdsH targeting lines. Left panel of a) shows the full-length transcript of OdsH (pink arrow) corresponding to nucleotide positions 0–4524 and Exon 1–Exon 4 (Ex1–Ex4) detected by RT-PCR in the OdsH+ line; no full-length transcript is detected in the OdsH1 line. Right panel of a) shows the short transcript of OdsH (pink arrow) corresponding to nucleotide positions 2240–3393 and Exon 2–Exon 3 (Ex2–Ex3) detected by RT-PCR in both OdsH+ and OdsH1 lines. b) The long-template PCR followed by BlpI digestion, resolving the genomic DNA structure at OdsH after gene targeting. The PCR amplicon obtained from the primer pair (wh 2053+, In2 2801) can be digested completely by the restriction enzyme BlpI resulting in two fragments for the two OdsH+ lines (pink arrows); however, the same amplicon for the OdsH1 line cannot be digested by BlpI, resulting in one large DNA fragment. The PCR amplicon obtained from the primer pair (In1 1855+, wh 479) can also be digested by BlpI, resulting in three DNA fragments for all three lines, the same for OdsH+ and OdsH1. As shown in c), the schematic structure of OdsH after gene targeting includes the endogenous Exon 1 (Ex1), the modified Exon 2 (ex2), partial Exon 3 (ex3), the white marker gene (w+), the downstream modified Exon 2 (ex2), and the endogenous Exon 3 (Ex3) and Exon 4 (Ex4). The primers (arrows) used in the genomic long-template PCR are indicated with their corresponding locations to OdsH Intro 1 (In1 1855+), the white marker gene, (wh 479) & (wh 2053+), and OdsH Intron 2 (In2 2801). A full-length OdsH containing all four exons, shown as Ex1–ex2–Ex3–Ex4, is produced by splicing from Exon 1 to modified Exon 2 downstream of the white marker; whereas OdsH+ has an Exon 2 coding sequence same as wild-type Exon 2, OdsH1 has nucleotide insertion (pink) in the modified Exon 2, resulting in a stop codon (*) and frameshift.
Fig. 5.
Fig. 5.
Drosophila cross for population setup. As shown in a), two reciprocal crosses were carried out to set up fly populations for competing OdsH+ against the wild-type OdsH: “Setup I” starts with females of homozygous OdsH+ carrying the white marker gene w+ in the white-mutant w genetic background (flies are red-eyed) and males of wild-type OdsH in the white-mutant w background (flies are white-eyed); in parallel, “Setup II” starts with females of homozygous wild-type OdsH in the white-mutant w background (flies are red-eyed) and males of OdsH+ carrying the white marker gene w+ (flies are white-eyed). Every generation includes the indicated genotypes; G0 initiates the population; G1 is the starting generation, followed by G2 and G3. b) The same scheme with two reciprocal crosses to set up fly populations for competing OdsH1 against the wild-type OdsH. OdsH1 is associated with w+ the same way as OdsH+.
Fig. 6.
Fig. 6.
Genotypic frequencies of wild-type OdsH (represented by w, white eye-color) in adult males and wild-type OdsH/OdsH (represented by w/w, white eye-color) in adult females over 20 generations of allelic competition in laboratory populations. As described in Fig. 5a, “setup I” (left panels) starts with females of homozygous OdsH+ (w+) and males of wild-type OdsH (w) at G0; therefore, starting in generation 1, the frequency for wild-type OdsH in adult males (p1) is 0 and the frequency for wild-type OdsH/OdsH in females (Q11) is also 0; the theoretical model for neutrality predicts p1 to be 0.333 and Q11 to be 0.111 by generation 20. By contrast, “setup II” (right panels) starts with females of homozygous wild-type OdsH (w) and males of OdsH+ (w+); therefore, starting in generation 1, the frequency for wild-type OdsH in adult males (p1) is 1 and the frequency for wild-type OdsH/OdsH in females (Q11) is 0; the theoretical model for neutrality predicts p1 to be 0.667 and Q11 to be 0.444 by generation 20. The generation numbers 1, 2, 3 correspond to G1, G2, G3 as illustrated in Fig. 5. Blue triangles are experimental data following the competition between OdsH+ [w+] and OdsH [w]; red circles are experimental data following the competition between OdsH1 [w+] and OdsH [w]. Blue lines and red lines are corresponding best-fit models for adult genotypic frequencies derived as equations (7) and (8). Frequency values are included in Supplementary Table S1.
Fig. 7.
Fig. 7.
Estimates of fitness components for OdsH+ and OdsH1 as they each compete against the wild-type OdsH and derivations of fitness differences between OdsH+ and OdsH1. Frequency values are included in Supplementary Table S1. The estimates for μ, ν, and ϵ were first derived from G2 according to equations (4) and (6) and were set as known ratios for viability effects. The three parameters for fertility effects, μ , ν , and ϵ, were estimated according to maximum likelihood criteria; confidence intervals (based on 95% χ2 value with one degree of freedom) for the fertility estimates are shown in the brackets next to the best-fit values. The fitness changes of OdsH+ over OdsH1 are calculated as follows: male viability increase =1μ(OdsH,OdsH+)/μ(OdsH,OdsH1 ); heterozygous female viability increase =1ν(OdsH,OdsH+)/ν(OdsH,OdsH1 ); homozygous female viability increase =1(ϵ(OdsH,OdsH1)/ν(OdsH,OdsH1))/(ϵ(OdsH,OdsH+)/ν(OdsH,OdsH+)); male fertility increase =1α(OdsH,OdsH+)/α(OdsH,OdsH1); heterozygous female fertility increase =1β(OdsH,OdsH+)/β(OdsH,OdsH1); homozygous female fertility increase =1(γ(OdsH,OdsH1)/β(OdsH,OdsH1))/(γ(OdsH,OdsH+)/β(OdsH,OdsH+)). Statistical significance for the viability changes is indicated: *P < 0.05 or **P < 0.001, with a χ2 test. The confidence intervals for the estimates of fertility changes are shown in the parentheses next to the values.

Similar articles

References

    1. Anderson WW. 1969. Selection in experimental populations. I. Lethal genes. Genetics. 62(3):653–672. doi:10.1093/genetics/62.3.653 - DOI - PMC - PubMed
    1. Barclay HJ, Fitz-Earle M. 1988. Maximum likelihood estimates of fitness in iteroparous species population replacement experiments using compound chromosomes. Genome. 30(1):83–88. doi:10.1139/g88-014 - DOI
    1. Bastide H, Ogereau D, Montchamp-Moreau C, Gérard PR. 2022. The fate of a suppressed X-linked meiotic driver: experimental evolution in Drosophila simulans. Chromosome Res. 30(2–3):141–150. doi:10.1007/s10577-022-09698-1 - DOI - PubMed
    1. Bayes JJ, Malik HS. 2009. Altered heterochromatin binding by a hybrid sterility protein in Drosophila sibling species. Science. 326(5959):1538–1541. doi:10.1126/science.1181756 - DOI - PMC - PubMed
    1. Beckenbach A. 1983. Fitness analysis of the “sex-ratio” polymorphism in experimental populations of Drosophila pseudoobscura. Am Nat. 121(5):630–648. doi:10.1086/284091 - DOI

LinkOut - more resources