. 2024 Oct;67(10):2225-2235.
doi: 10.1007/s00125-024-06221-5. Epub 2024 Jul 13.

Ultra-processed food consumption and risk of diabetes: results from a population-based prospective cohort

Affiliations

Ultra-processed food consumption and risk of diabetes: results from a population-based prospective cohort

Shutong Du et al. Diabetologia. 2024 Oct.

Abstract

Aims/hypothesis: Understanding the impact of the overall construct of ultra-processed foods on diabetes risk can inform dietary approaches to diabetes prevention. In this study, we aimed to evaluate the association between ultra-processed food consumption and risk of diabetes in a community-based cohort of middle-aged adults in the USA. We hypothesised that a higher intake of ultra-processed foods is associated with a higher risk of incident diabetes.

Methods: The study included 13,172 participants without diabetes at baseline (1987-1989) in the Atherosclerosis Risk in Communities (ARIC) study. Dietary intake was assessed with a 66-item semiquantitative food frequency questionnaire, and foods were categorised by processing level using the Nova classification system. Ultra-processed food was analysed categorically (quartiles of energy-adjusted intake) and continuously (per one additional serving/day). We used Cox regression to evaluate the association of ultra-processed food intake with risk of diabetes with adjustment for sociodemographic characteristics, total energy intake, health behaviours and clinical factors.

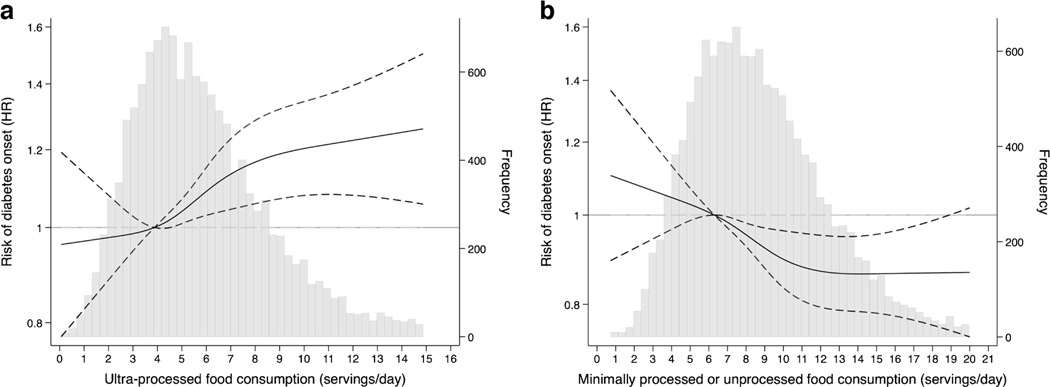
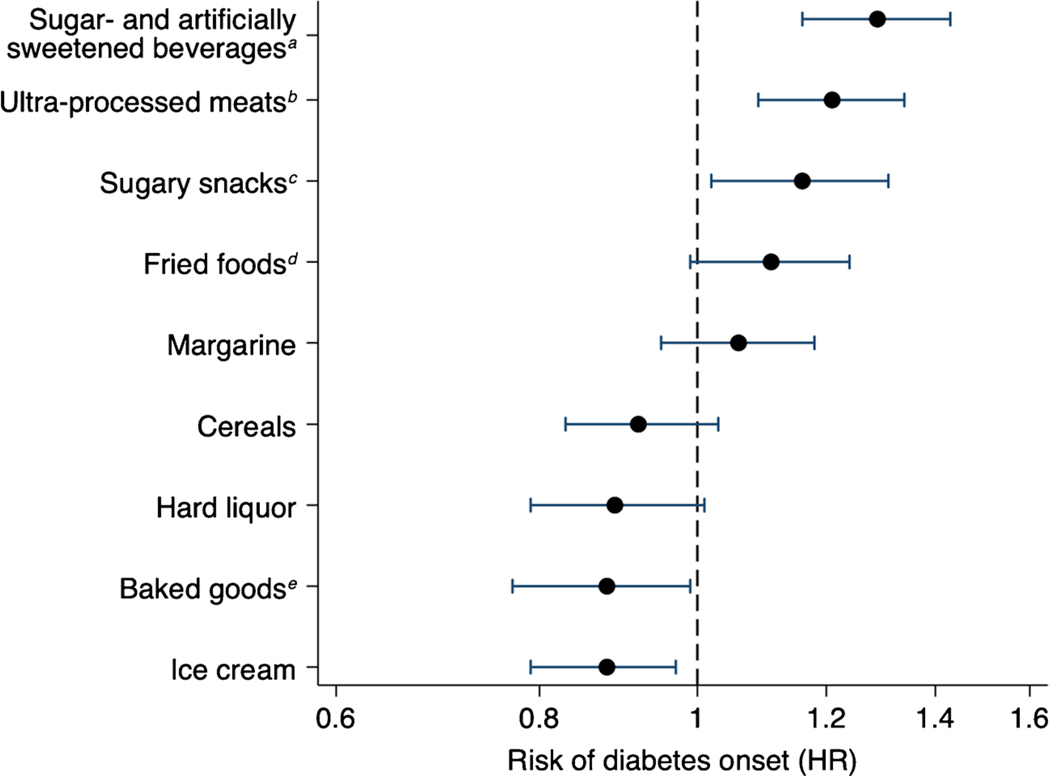
Results: Over a median follow-up of 21 years, there were 4539 cases of incident diabetes. Participants in the highest quartile of ultra-processed food intake (8.4 servings/day on average) had a significantly higher risk of diabetes (HR 1.13; 95% CI 1.03, 1.23) compared with participants in the lowest quartile of intake after adjustment for sociodemographic, lifestyle and clinical factors. Each additional serving of ultra-processed food consumed daily was associated with a 2% higher risk of diabetes (HR 1.02; 95% CI 1.00, 1.04). Highest quartile consumption of certain ultra-processed food groups, including sugar- and artificially sweetened beverages, ultra-processed meats and sugary snacks, was associated with a 29%, 21% and 16% higher risk of diabetes, respectively, compared with the lowest quartile.

Conclusions/interpretation: We found that a higher intake of ultra-processed food was associated with higher risk of incident diabetes, particularly sugar- and artificially sweetened beverages, ultra-processed meats and sugary snacks. Our findings suggest interventions reducing ultra-processed food consumption and specific food groups may be an effective strategy for diabetes prevention.

Keywords: ARIC study; Diabetes prevention; Diet and nutrition; Nova classification; Sugar-sweetened beverages; Ultra-processed food.


Figures

Fig. 1
Fig. 1
Association between ultra-processed (a) and minimally processed or unprocessed (b) food intake and risk of incident diabetes represented by restricted cubic splines. The model was adjusted for age, sex, race–centre, total energy intake, smoking status, physical activity score, education level, hypertension status and kidney function (two linear spline terms with one knot at 90 ml/min per 1.73 m2). The black solid line represented the adjusted HR of incident diabetes. The black dashed lines represent the 95% CI. The grey histogram represents the frequency of ultra-processed food consumption (a) and minimally processed or unprocessed food consumption (b) in the study population. For ultra-processed foods, the reference level was set at the 25th percentile (3.9 servings per day), and 4 knots were set at the 5th, 35th, 65th and 95th percentiles (2.2, 4.5, 6.4 and 10.9 servings per day, respectively). For minimally processed or unprocessed foods, the reference level was set at the 25th percentile (6.3 servings per day), and 4 knots were set at the 5th, 35th, 65th and 95th percentiles (4.0, 7.2, 9.7 and 14.9 servings per day, respectively)
Fig. 2
Fig. 2
Risk of incident diabetes associated with consumption of specific ultra-processed food items or groups. HR for incident diabetes were calculated for highest consumption (quartile 4) vs lowest consumption (quartile 1) of the specific ultra-processed food items or groups. Model included all food groups simultaneously while adjusting for age, sex, race–centre, total energy intake, smoking status, physical activity score, education level, hypertension status and kidney function (two linear spline terms with 1 knot at 90 ml/min per 1.73 m2). aSugar- and artificially sweetened beverages included orange or grapefruit juice, low energy soft drinks (e.g. Diet Coke, Diet Pepsi, 7 Up Zero Sugar) and regular soft drinks (e.g. Coca-Cola, Pepsi, 7 Up, ginger ale), fruit-flavoured punch or non-carbonated beverages (e.g. lemonade, Kool-Aid, Hawaiian Punch; not diet). bUltra-processed meats included hamburgers, hot dogs, processed meats (e.g. sausage, salami, bologna); beef, pork or lamb in dishes. cSugary snacks included chocolate bars or pieces (e.g. Hershey’s, Plain M&M’s, Snickers, Reese’s), candy without chocolate. dFried foods included potato chips or corn chips, French fried potatoes, food fried away from home. eBaked goods included ready-made pie, doughnuts, biscuits or cornbread; Danish pastry, sweet roll, coffee cake and croissant; cookies, cake or brownie. Hard liquor is also termed ‘spirits’ (e.g. vodka, rum, gin, whisky, tequila)

References

    1. Martini D, Godos J, Bonaccio M, Vitaglione P, Grosso G (2021) Ultra-processed foods and nutritional dietary profile: a meta-analysis of nationally representative samples. Nutrients 13(10):3390. 10.3390/nu13103390 - DOI - PMC - PubMed
    1. Monteiro CA, Cannon G, Levy RB et al. (2019) Ultra-processed foods: what they are and how to identify them. Public Health Nutr 22(5):936–941. 10.1017/S1368980018003762 - DOI - PMC - PubMed
    1. Hall KD, Ayuketah A, Brychta R et al. (2019) Ultra-processed diets cause excess calorie intake and weight gain: an inpatient randomized controlled trial of ad libitum food intake. Cell Metab 30(1):67–77.e3. 10.1016/j.cmet.2019.05.008 - DOI - PMC - PubMed
    1. Canhada SL, Vigo Á, Luft VC et al. (2023) Ultra-processed food consumption and increased risk of metabolic syndrome in adults: The ELSA-Brasil. Diabetes Care 46(2):369–376. 10.2337/dc22-1505 - DOI - PMC - PubMed
    1. Du S, Kim H, Rebholz CM (2021) Higher Ultra-processed food consumption is associated with increased risk of incident coronary artery disease in the atherosclerosis risk in communities study. J Nutr 151(12):3746–3754. 10.1093/jn/nxab285 - DOI - PMC - PubMed

LinkOut - more resources