. 2024 Jul 23;43(7):114491.
doi: 10.1016/j.celrep.2024.114491. Epub 2024 Jul 13.

Multi-step regulation of microRNA expression and secretion into small extracellular vesicles by insulin

Affiliations

Multi-step regulation of microRNA expression and secretion into small extracellular vesicles by insulin

Marsel Lino et al. Cell Rep. .

Abstract

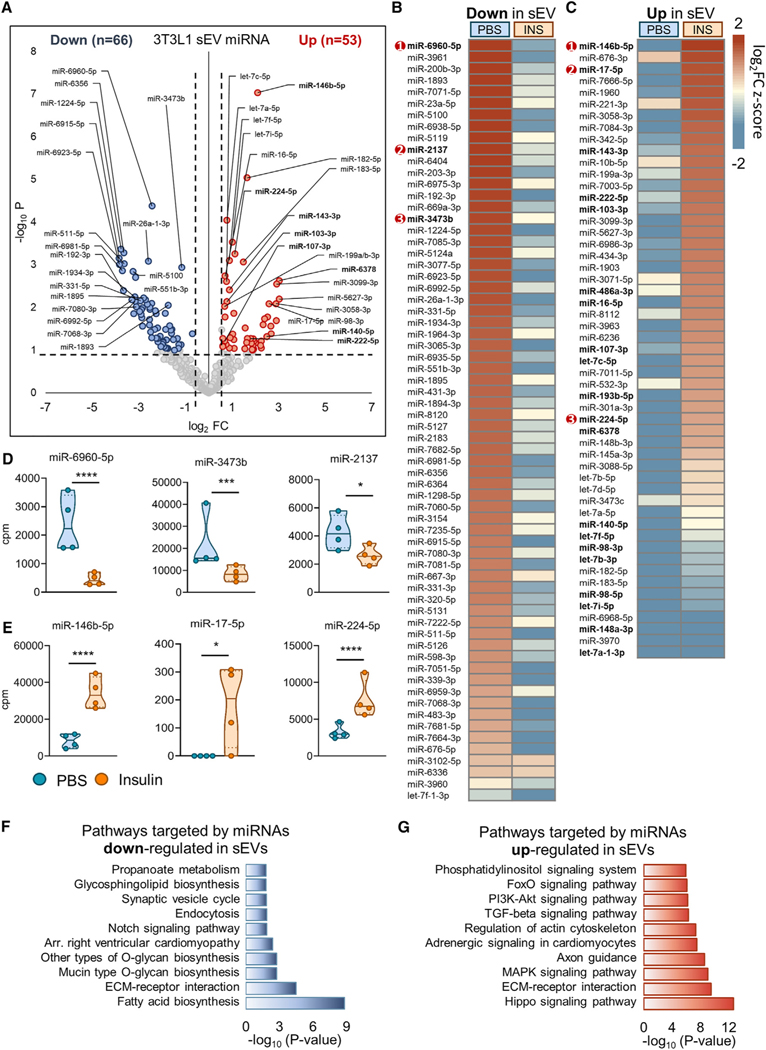
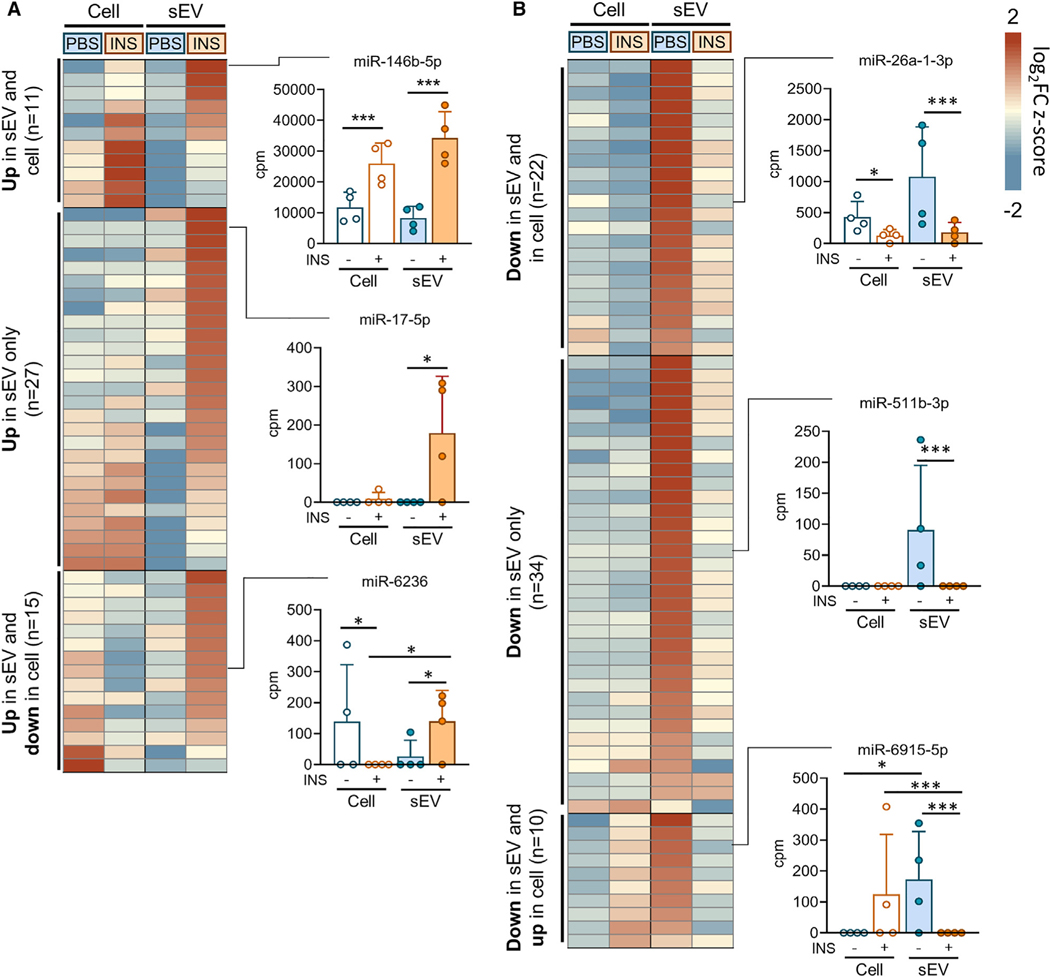
Tissues release microRNAs (miRNAs) in small extracellular vesicles (sEVs) including exosomes, which can regulate gene expression in distal cells, thus acting as modulators of local and systemic metabolism. Here, we show that insulin regulates miRNA secretion into sEVs from 3T3-L1 adipocytes and that this process is differentially regulated from cellular expression. Thus, of the 53 miRNAs upregulated and 66 miRNAs downregulated by insulin in 3T3-L1 sEVs, only 12 were regulated in parallel in cells. Insulin regulated this process in part by phosphorylating hnRNPA1, causing it to bind to AU-rich motifs in miRNAs, mediating their secretion into sEVs. Importantly, 43% of insulin-regulated sEV-miRNAs are implicated in obesity and insulin resistance. These include let-7 and miR-103, which we show regulate insulin signaling in AML12 hepatocytes. Together, these findings demonstrate an important layer to insulin's regulation of adipose biology and provide a mechanism of tissue crosstalk in obesity and other hyperinsulinemic states.

Keywords: CP: Metabolism; CP: Molecular biology; RNA binding proteins; adipocyte; exosomes; extracellular miRNAs; insulin; insulin signaling; miRNA; small extracellular vesicles.


Conflict of interest statement

Declaration of interests The authors declare no competing interests.

Figures

Figure 1.
Figure 1.. Insulin regulates smRNAs in 3T3-L1 cells and their sEVs
(A) Expression of miRNA processing genes in differentiated 3T3-L1 adipocytes treated with 100 nM insulin for 1 h (white) and 6 h (blue), or PBS control (gray). (B–E) 3T3-L1 adipocytes were stimulated for 48 h with 100 nM insulin or PBS to assess insulin-mediated regulation of miRNA expression and secretion in sEVs. (B and D) Composition of smRNA reads in cells (B) and sEVs (D), comparing basal and INS state. (C) sEV concentration and size distribution was assessed by nanoparticle tracking analysis. (E) Violin plots of miRNA abundance in 3T3-L1 cells and their sEVs in the basal (PBS) or INS state. For (A), data represent mean ± SD (n = 3). For (E), violin plots depict the mean (solid line in center) and interquartile range (dotted lines above and below mean). Statistical analysis was performed by t test (*p < 0.05; **p < 0.01; ****p < 0.0001). See also Figure S1.
Figure 2.
Figure 2.. Insulin regulates cellular expression of miRNAs in 3T3-L1 cells
(A) Heatmap displaying insulin-regulated miRNAs, including 12 upregulated miRNAs (top) and 43 downregulated miRNAs (bottom). Select miRNAs (marked by red number) are plotted in (C) to illustrate abundance and change in expression by insulin in 3T3-L1 cells. (B) Volcano plot depicting miRNAs significantly regulated by insulin in 3T3-L1 cells. Highlighted miRNAs correspond to miRNAs in (C) and (D). (C) Insulin upregulated miRNAs (top) and downregulated miRNAs (bottom) are shown, corresponding to highlighted miRNAs in (A). (D and E) Insulin-regulated miRNA clusters including the miR-182/183 cluster (D) and the miR-191/425 cluster (E). For (A), the heatmap is sorted by log2FC (descending), and the color scale represents average Z score (n = 4). For (C)–(E), violin plots depict the mean (solid line in center) and interquartile range (dotted lines above and below mean). Statistical analysis was performed by t test (*p < 0.05; **p < 0.01; ***p < 0.001; ****p < 0.0001). See also Figure S2.
Figure 3.
Figure 3.. Insulin regulates miRNA secretion in sEVs, targeting metabolic pathways
(A) Volcano plot depicting miRNAs downregulated by insulin (n = 66, blue) and miRNAs upregulated by insulin (n = 53, red) in 3T3-L1 sEVs. (B and C) Heatmaps showing miRNAs downregulated (B) or upregulated (C) by insulin in 3T3-L1 sEVs. Red numbering corresponds to violin plots in (D) and (E). Bolded miRNAs in (C) highlight miRNAs previously linked to obesity or adipogenesis. (D and E) Violin plots depicting miRNAs downregulated (D) or upregulated (E) by insulin in sEVs. (F and G) Pathway enrichment analysis was performed using predicted gene targets of miRNAs that were down- or upregulated by insulin in 3T3-L1 sEVs. The top 10 pathways targeted by downregulated (F) or upregulated (G) miRNAs are shown. For (B) and (C), the heatmap is sorted by average Z score in basal (descending) or INS state (descending), respectively (n = 4). The color scale represents average Z score (n = 4). For (D) and (E), violin plots depict the mean (solid line in center) and interquartile range (dotted lines above and below mean). Statistical analysis was performed by t test (*p < 0.05; **p < 0.01; ***p < 0.001; ****p < 0.0001). See also Figure S3 and Table S1.
Figure 4.
Figure 4.. Insulin regulates miRNA abundance in sEVs independently of cells
(A) Heatmap depicting average Z score of insulin-upregulated miRNAs in 3T3-L1 sEVs (right 2 columns) and their expression in cells (left 2 columns). (B) Heatmap depicting average Z score of insulin-downregulated miRNAs and their expression in 3T3-L1 cells (left 2 columns) and sEVs (right 2 columns). (A and B) Heatmaps are sub-grouped into miRNAs coordinately regulated in sEVs and cells (top), regulated only in sEVs (center), or oppositely regulated in sEVs and cells (bottom). Representative miRNAs from each category were plotted. For (A) and (B), the color scale represents average Z score (n = 4). Bar graphs depict mean ± SD (n = 4). Statistical analysis was performed by t test (*p < 0.05; **p < 0.01; ***p < 0.001).
Figure 5.
Figure 5.. Insulin regulates enrichment and secretion of miRNAs in 3T3-L1 cells
(A) Waterfall plot showing sEV-enriched (log2FC ≥ 2, n = 90) and cell-enriched (log2FC ≤ −2, n = 47) miRNAs in basal state. (B) Waterfall plot showing sEV-enriched (log2FC ≥ 2, n = 79) and cell-enriched (log2FC ≤ −2, n = 35) miRNAs in the INS state. (C) Total abundance of enriched miRNAs in sEVs or cells in basal and INS state (n = 4). (D) Change in miRNA enrichment by insulin, where cell-enriched miRNAs are defined by log2FC(sEV/cell) < −1 and sEV-enriched miRNAs are defined by log2FC(sEV/cell) > +1. Change in enrichment between PBS (white dots) and INS state (gray dots) is depicted by connecting arrows (orange for miRNAs secreted by insulin and blue for miRNAs retained by insulin). (E) Bar plots of miRNA enrichment in basal and insulin state of example miRNAs. (F and H) Assessment of insulin signaling in AML12 hepatocytes after overexpression of miR-103–3p or let-7f-5p. (G and I) Quantification of IR-β and Akt protein abundance, as well as INS p-Akt/Akt ratio in AML12 cells overexpressing (G) miR-103–3p, or (I) let-7f-5p. For (D), dots depict mean (n = 4). For (C), (E), (G), and (I), data represent mean ± SD (n = 3–6). Statistical analysis was performed by t test (*p < 0.05; **p < 0.01; ***p < 0.001; ****p < 0.0001). See also Figure S4.
Figure 6.
Figure 6.. Insulin regulates miRNA sorting and secretion into sEVs by modulating RBP recognition of miRNA motifs
(A) Enriched motif analysis using HOMER software was performed in sEV-miRNAs secreted or retained by insulin. Eight motifs were identified (FDR <0.18), 5 of which were AU rich and enriched among miRNAs secreted by insulin in 3T3-L1 sEVs, whereas 3 poly-G motifs were enriched among miRNAs retained by insulin in 3T3-L1 cells. (B and D) Cellular and sEV expression of miR-103–3p (B) and miR-320–5p (D) in 3T3-L1 cells stimulated with insulin for 1 or 6 h (white and blue bars, respectively) or PBS (gray). (C and E) WT and mutated (MUT) biotin-conjugated miRNAs were incubated with cell lysate from 3T3-L1 cells treated with or without insulin (100 nM, 1 h). WT and MUT miRNA sequences are shown, with AU-rich or poly-G motifs highlighted in gray and mutated nucleotides in blue. Protein-miRNA complexes were pulled down with streptavidin-coated dynabeads, and hnRNPA1 was detected by immunoblot. Immunoblot for p-Akt, pan-Akt, hnRNPA1, and β-actin was performed in input samples to confirm insulin action and equal loading. (F) hnRNPA1 was immunoprecipitated in 3T3-L1 cells stimulated with insulin for 1 h, and p-Akt substrate phosphorylation was assessed. (G) Knockdown of hnRNPA1 was confirmed by immunoblot. (H) Cellular and sEV level of miR-103–3p in 3T3-L1 cells stimulated with insulin for 1 h after hnRNPA1 knockdown. For (B), (D), and (H), data represent mean ± SD (n = 3). For (B) and (D), statistical analyses were performed by 1-way ANOVA. For (H), statistical analysis was performed by t test (comparing basal to INS level). Asterisks denote significance (*p < 0.05; **p < 0.01). See also Figure S5.

References

    1. Haider N, Lebastchi J, Jayavelu AK, Batista TM, Pan H, Dreyfuss JM, Carcamo-Orive I, Knowles JW, Mann M, and Kahn CR (2021). Signaling defects associated with insulin resistance in nondiabetic and diabetic individuals and modification by sex. J. Clin. Invest 131, e151818. 10.1172/JCI151818. - DOI - PMC - PubMed
    1. Batista TM, Haider N, and Kahn CR (2021). Defining the underlying defect in insulin action in type 2 diabetes. Diabetologia 64, 994–1006. 10.1007/s00125-021-05415-5. - DOI - PMC - PubMed
    1. Batista TM, Jayavelu AK, Wewer Albrechtsen NJ, Iovino S, Lebastchi J, Pan H, Dreyfuss JM, Krook A, Zierath JR, Mann M, and Kahn CR (2020). A Cell-Autonomous Signature of Dysregulated Protein Phosphorylation Underlies Muscle Insulin Resistance in Type 2 Diabetes. Cell Metab. 32, 844–859.e5. 10.1016/j.cmet.2020.08.007. - DOI - PMC - PubMed
    1. Fazakerley DJ, van Gerwen J, Cooke KC, Duan X, Needham EJ, Dáz-Vegas A, Madsen S, Norris DM, Shun-Shion AS, Krycer JR, et al. (2023). Phosphoproteomics reveals rewiring of the insulin signaling network and multi-nodal defects in insulin resistance. Nat. Commun 14, 923. 10.1038/s41467-023-36549-2. - DOI - PMC - PubMed
    1. White MF, and Kahn CR (2021). Insulin action at a molecular level - 100 years of progress. Mol. Metab 52, 101304. 10.1016/j.molmet.2021.101304. - DOI - PMC - PubMed

Publication types