. 2024 Jul 13;15(1):5895.
doi: 10.1038/s41467-024-50192-5.

Unraveling the molecular architecture of autoimmune thyroid diseases at spatial resolution

Affiliations

Unraveling the molecular architecture of autoimmune thyroid diseases at spatial resolution

Rebeca Martínez-Hernández et al. Nat Commun. .

Abstract

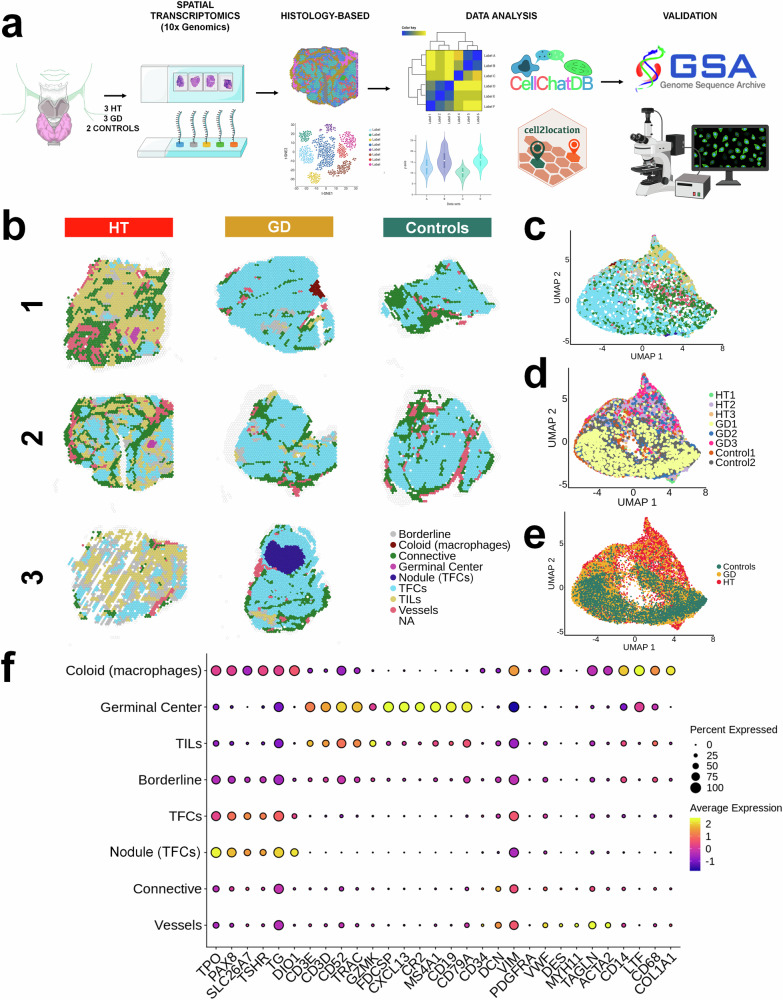
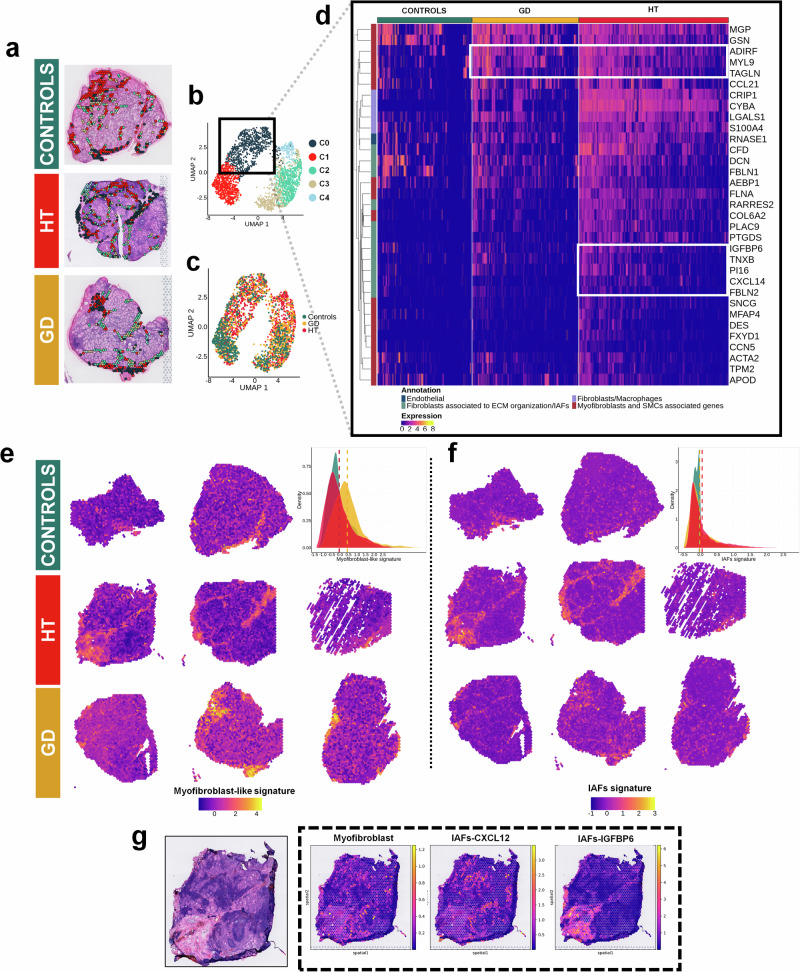
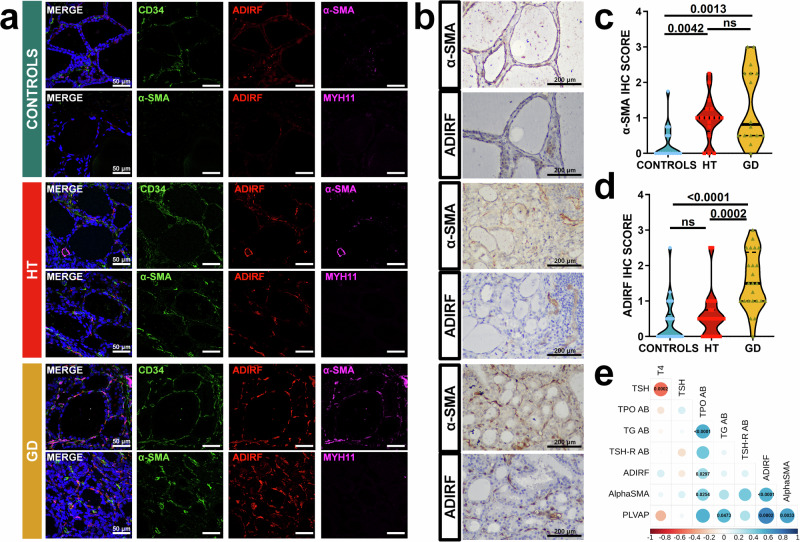
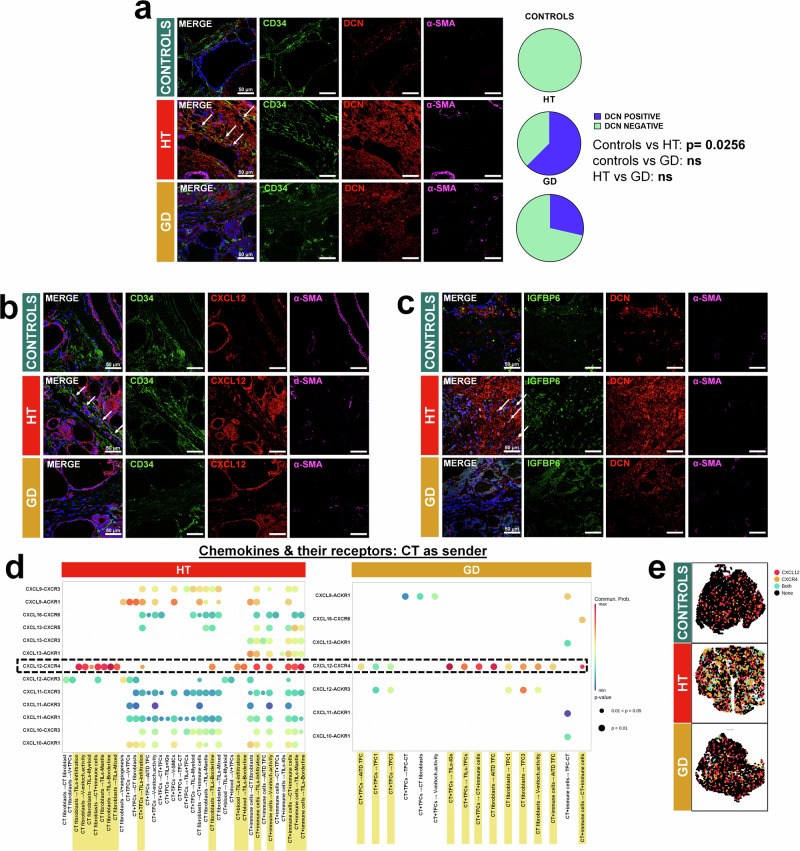
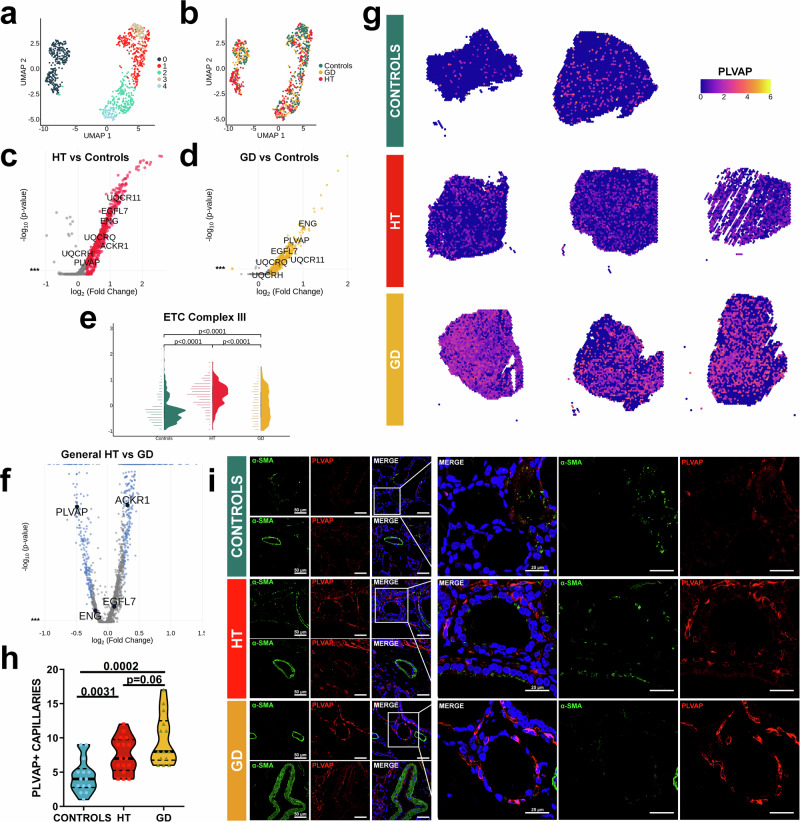
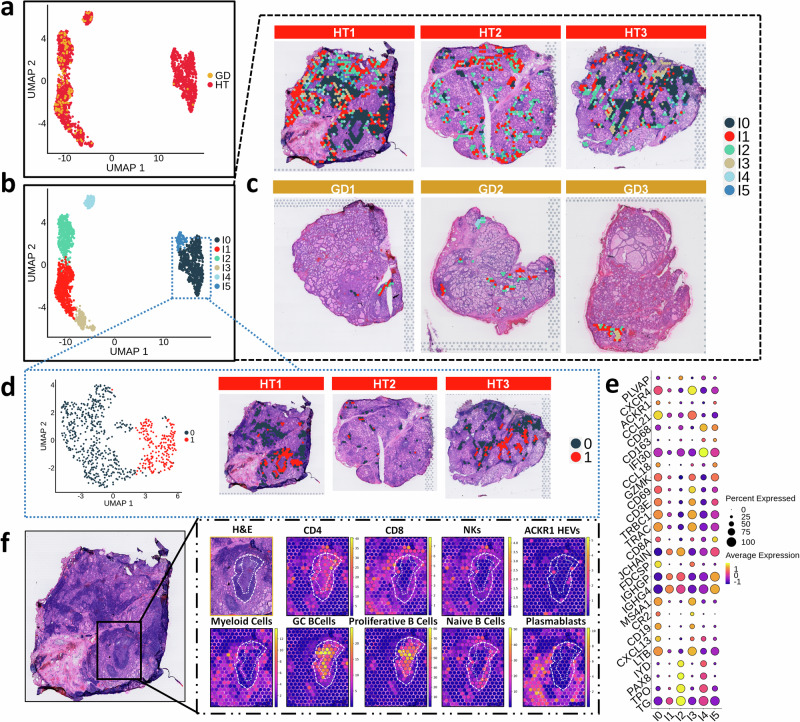
Autoimmune thyroid diseases (AITD) such as Graves' disease (GD) or Hashimoto's thyroiditis (HT) are organ-specific diseases that involve complex interactions between distinct components of thyroid tissue. Here, we use spatial transcriptomics to explore the molecular architecture, heterogeneity and location of different cells present in the thyroid tissue, including thyroid follicular cells (TFCs), stromal cells such as fibroblasts, endothelial cells, and thyroid infiltrating lymphocytes. We identify damaged antigen-presenting TFCs with upregulated CD74 and MIF expression in thyroid samples from AITD patients. Furthermore, we discern two main fibroblast subpopulations in the connective tissue including ADIRF+ myofibroblasts, mainly enriched in GD, and inflammatory fibroblasts, enriched in HT patients. We also demonstrate an increase of fenestrated PLVAP+ vessels in AITD, especially in GD. Our data unveil stromal and thyroid epithelial cell subpopulations that could play a role in the pathogenesis of AITD.


Conflict of interest statement

H.H. is a co-founder and shareholder of Omniscope, a scientific advisory board member of MiRXES and Nanostring, and a consultant to Moderna and Singularity. The remaining authors declare no competing financial or non-financial interests.

Figures

Fig. 1
Fig. 1. Histology-based classification.
a Overview of the study design. Created with BioRender.com, released under a Creative Commons Attribution-NonCommercial-NoDerivs 4.0 International license. b Spatial transcriptomics spots were classified according to their histological appearance. c Molecular UMAP colored according to histology-based classification. d Molecular UMAP of samples. e UMAP colored according to the different conditions. f Dot plot of canonical markers per tissue and their expression across areas. TFCs thyroid follicular cells, TILs thyroid infiltrating lymphocytes, HT Hashimoto´s thyroiditis, GD Graves´ disease, UMAP Uniform Manifold Approximation and Projection for Dimension Reduction.
Fig. 2
Fig. 2. Molecular profiling of TFCs identifies altered subpopulations in HT and GD samples.
a Violin plots showing the comparison of Thyrocyte Differentiation Score (TDS) of TFCs spots between conditions. HT (n = 3): spots = 1247, median = −0.009 [−0.154, 0.142]; GD (n = 3): spots = 4133, 0.755 [0.539, 0.958]; controls (n = 2): spots = 1884, median = controls: 0.785 [0.576, 0.975]; all adjusted two-sided p values. b Spatial distribution of the TDS in TFCs spots. c UMAP at 0.3 resolution of TFCs spots. d Spatial disposition of TFCs clusters at 0.3 resolution. e UMAP of TFCs spots colored according to conditions: controls, GD, and HT. f Volcano Plot of differential expression analysis between cluster T1 (red) and the rest of the clusters. Blue spots represent statistically significant genes with logarithmic fold changes of more than +0.25 and less than −0.25. g Spatial distribution of the CD74-MIF score in TFCs spots. h Box plot of the CD74 and MIF score in all conditions. HT (n = 3): spots = 1247, median = 2.202 [2.016, 2.394]; GD (n = 3): spots = 4133, median = 1.620 [1.092, 2.036]; controls (n = 2): spots = 1884, median = 0.115 [−0.485, 0.605]; all adjusted two-sided p values. i Representative images of CD74 and MIF immunostaining in serial sections of thyroid tissue from controls, HT, and GD patients. Scale bar: 200 μm. Stainings were confirmed in at least seven biological replicates. j MIF signaling networks: Heatmaps display the condition of each spatial cluster as sender or receiver of MIF ligand and their contribution. Circle plot represents the strengthening of the TFCs clusters as senders of MIF and their receivers. Spatial plot of MIF and CD74-CD44 in controls, HT, and GD samples. k Re-clustering of the AITD TFCs cluster (T1). Top left: UMAP of the re-clustering of the AITD TFCs cluster. Top right: Re-clustering colored by conditions. Below: Barplot of the top KEGG pathways from the differential gene expression between HT (dark red) and GD (dark yellow) in the re-clustering. Dunn test for statistical analysis and adjusted two-sided p values with Holm (a, h) and with Bonferroni (f). TDS thyroid differentiation score, HT Hashimoto´s thyroiditis, GD Graves´ disease, UMAP Uniform Manifold Approximation and Projection for Dimension Reduction, TFCs thyroid follicular cells, CT connective tissue, V Vessels, TILs thyroid infiltrating lymphocytes, SMCs smooth muscle cells, IGs immunoglobulins.
Fig. 3
Fig. 3. Analysis of the connective tissue reveals different fibroblast subpopulations in HT and GD samples.
a Spatial distribution of CT clusters at 0.3 resolution. b UMAP of the connective tissue clustering at 0.3 resolution. c Distribution per condition in the UMAP colored by condition. d Hierarchical clustering of the top markers of cluster 0. e Myofibroblasts-like signature: Spatial distribution and density plot across conditions. HT (n = 3): spots = 6403, mean = −0.046 ± 0.770, GD (n = 3): spots = 6583, mean = 0.431 ± 0.844, controls (n = 2): spots = 3592, mean = −0.035 ± 0.725. f IAFs signature: Spatial distribution and density plot across conditions. HT (n = 3): spots = 6403, mean = 0.051 ± 0.429, GD (n = 3): spots = 6583, mean = −0.023 ± 0.362, controls (n = 2): spots = 3592, mean = −0.033 ± 0.280. g Spots deconvolution of HT samples: proportion and location of myofibroblasts and IAFs subpopulations (CXCL12 IAFs and IGFBP6 IAFs). Side bars show the expected cell abundance. Dunn test for statistical analysis and adjusted two-sided p values with Holm (e, f). IAFs inflammatory-associated fibroblasts, HT Hashimoto´s thyroiditis, GD Graves´ disease, UMAP Uniform Manifold Approximation and Projection for Dimension Reduction, ECM extracellular matrix, SMCs smooth muscle cells.
Fig. 4
Fig. 4. Immunostaining of myofibroblasts markers from HT, GD, and control thyroid tissues.
a Representative confocal immunofluorescence images, in healthy control, HT and GD tissue samples, of the myofibroblast markers a-SMA (magenta), and ADIRF (red) in combination with a mesenchymal marker, CD34 (green) or a smooth muscle cell marker, MYH11 (magenta). Nuclei are stained with DAPI (blue). Objective: 63X. Scale bar: 50 μm. b Immunohistochemistry of ADIRF and a-SMA in serial tissue sections form controls, HT, and GD patients. Scale 200 μm. c, d Quantification of α-SMA and ADIRF in thyroid tissue from controls, HT, and GD patients. The quantification is described in Methods section. Kruskal-Wallis test and Dunn´s test for statistical analysis and adjusted two-sided p values. e Analysis of correlation between clinical parameters and immunohistochemical scores with Spearman rho test and two-sided p values. The area of the circles shows the absolute value of corresponding correlation coefficients, Data are expressed as the arithmetic mean ± SD. Stainings were confirmed in at least seven biological replicates. HT Hashimoto’s thyroiditis, GD Graves´ disease, TSH thyroid stimulating hormone, TPOAB thyroid peroxidase autoantibodies, TGAB thyroglobulin autoantibodies, TSH-R AB thyroid stimulating hormone receptor autoantibodies.
Fig. 5
Fig. 5. Immunostaining of different IAF markers in HT, GD, and control thyroid tissues.
a Representative confocal immunofluorescence images, in healthy control, HT and GD tissue samples, of the IAFs marker DCN (red) combined with a mesenchymal/fibroblast marker, CD34 (green) and a myofibroblast marker, α-SMA (magenta). Nuclei are stained with DAPI (blue). Arrows indicate colocalization of CD34 and DCN. Objective: 63X. Scale bar: 50 μm. Right panels, quantification of DCN in thyroid tissue samples. Quantification is described in Methods section.χ2-square test for statistical analysis (p = 0.0338) Fisher´s exact test for individual comparisons and adjusted two-sided p values. b Representative confocal immunofluorescence images, in healthy control, HT, and GD tissue samples, of CXCL12 (red) in combination with a mesenchymal/fibroblast marker, CD34 (green), and a myofibroblast marker, α-SMA (magenta). Nuclei are stained with DAPI (blue). Arrows indicate colocalization of CD34 and CXCL12. Objective: 63X. Scale bar: 50 μm. c Representative confocal immunofluorescence images, in healthy control, HT, and GD tissue samples, of IGFBP6 (green) in combination with DCN (red) and a myofibroblast marker, α-SMA (magenta). Nuclei are stained with DAPI (blue). Arrows indicate colocalization of IGFBP6 and DCN. Objective: 63X. Scale bar: 50 μm. Stainings were confirmed in at least seven biological replicates. d Chemokines sent by CT clusters and their receptors in HT and GD samples. CXCL12-CXCR4 is depicted with dashed lines, and significant interactions between regions are highlighted in yellow. Circle size corresponds to the p value, and probability scores are indicated by color. e Spatial plot of CXCL12 and CXCR4 in controls, HT, and GD samples. AITD autoimmune thyroid diseases, HT Hashimoto´s thyroiditis, GD Graves´ disease, CT connective tissue, TFCs thyroid follicular cells, TILs thyroid infiltrating lymphocytes, V vessels, SMCs smooth muscle cells, IGs immunoglobulins.
Fig. 6
Fig. 6. Analysis of ST data from vessel annotated-spots and distribution of PLVAP+ capillaries.
a Clustering at 0.3 resolution of the vessels zones from spatial transcriptomic data of AITD and control samples. b Distribution of conditions across the clustering of vessel zones. Volcano plots and remarkable genes of the differential gene expression within vessels areas between (c) HT and controls and (d) GD and controls. e Representation of the expression signature of ETC complex III genes (UQCR11, UQCRQ, UQCRH genes) across conditions within vessels areas. Dunn test: HT (n = 3): spots = 404, median = 0.459 [0.106, 0.736]; GD (n = 3): spots = 211, median = −0.001 [−0.468, 0.517]; controls (n = 2): spots = 254, median = −0.266[−0.567, 0.040]; all p adjusted by Holm test <0.001. f Volcano plot of the general differential expression analysis between HT and GD. g Spatial distribution of PLVAP in control, HT and GD samples (h) Violin plots comparing the quantification of PLVAP+ capillaries between the three groups. T test with Welch´s correction for statistical analysis and adjusted two-sided p values (i) Representative confocal immunofluorescence images, in healthy control, HT, and GD tissue samples, of PLVAP (red) and α-SMA (green). Nuclei are stained with DAPI (blue). Objective: 63X. Scale bar: 50 μm, zoom: 25 μm. Stainings were confirmed in at least seven biological replicates. Adjusted p value with Bonferroni (c, d, f) ST spatial transcriptomics, HT Hashimoto´s thyroiditis, GD Graves’ disease, UMAP Uniform Manifold Approximation and Projection for Dimension Reduction, ETC electron transport chain.
Fig. 7
Fig. 7. Analysis of TILs and GC in HT and GD samples. Deconvolution of the spots using immune cells signatures.
a UMAP of all the spots of the TILs regions from HT and GD samples. b UMAP colored by the different clusters at 0.3 resolution. c Spatial mapping of TILs clusters. d UMAP and spatial mapping of I0 re-clustering at a resolution of 0.1. e Dot plot of representative markers of immune and stroma cells across clusters of TILs. f Hematoxylin and eosin and GC region detail showing the proportions of deconvoluted immune cells using signatures from scRNAseq analysis. Dotted white lines delineate the mantle (between outer and inner lines) and the GC, including the light and dark zones (inner line). H&E hematoxylin & eosin, HT Hashimoto´s thyroiditis, GD Graves´ disease, UMAP Uniform Manifold Approximation and Projection for Dimension Reduction, GC Germinal Center, TILs thyroid infiltrating lymphocytes, HEVs high endothelial venules.
Fig. 8
Fig. 8. Schematic hypothetical model of the role of different cell compartments in  AITD pathogenesis.
HT model (a) and GD model (b). After immune tolerance breakdown and damage of thyroid tissue, TFCs may induce the expression of CD74 that could interact with its ligand MIF through an autocrine loop. Their interaction contributes to tissue repair but also can promote chemoattraction of additional immune cells to the gland. This positive feedback might enhance the immune response against the thyroid, via MHC mediated antigen presentation. In GD, the proinflammatory environment would promote the proliferation of fibroblasts and their differentiation into myofibroblasts (ADIRF- and ADIRF+). Alternatively, in the case of HT, fibroblasts will differentiate mostly to IAFs that would synergize with immune cells in TFCs destruction and also will contribute to the generation of fibrotic tissue, and to the production of chemoattractant and proinflammatory cytokines. In both diseases, angiogenesis would be enhanced accompanied by an increased vessel permeability with some differences between them: PLVAP+ fenestrated vessels appear mainly in GD while ACKR1+ HEVs are mainly present in HT. HT Hashimoto´s thyroiditis, GD Graves´ disease, TFCs thyroid follicular cells, TGF-β transforming growth factor β. Created with BioRender.com, released under a Creative Commons Attribution-NonCommercial-NoDerivs 4.0 International license.

References

    1. Quintans J, Degroot LJ. The causes of autoimmune thyroid disease*. Endocr. Rev. 1989;10:537–562. doi: 10.1210/edrv-10-4-537. - DOI - PubMed
    1. Antonelli A, Ferrari SM, Corrado A, Di Domenicantonio A, Fallahi P. Autoimmune thyroid disorders. Autoimmun. Rev. 2015;14:174–180. doi: 10.1016/j.autrev.2014.10.016. - DOI - PubMed
    1. Ramos-Leví AM, Marazuela M. Pathogenesis of thyroid autoimmune disease: the role of cellular mechanisms. Endocrinol. Nutr. 2016;63:421–429. doi: 10.1016/j.endonu.2016.04.003. - DOI - PubMed
    1. Ajjan RA, Weetman AP. The pathogenesis of Hashimoto’s thyroiditis: further developments in our understanding. Horm. Metab. Res. 2015;47:702–710. doi: 10.1055/s-0035-1548832. - DOI - PubMed
    1. Brand OJ, et al. Association of the thyroid stimulating hormone receptor gene (TSHR) with Graves’ disease. Hum. Mol. Genet. 2009;18:1704–1713. doi: 10.1093/hmg/ddp087. - DOI - PubMed

MeSH terms

Substances

LinkOut - more resources