. 2024 Jul 13;15(1):5898.
doi: 10.1038/s41467-024-50281-5.

Early human fetal lung atlas reveals the temporal dynamics of epithelial cell plasticity

Affiliations

Early human fetal lung atlas reveals the temporal dynamics of epithelial cell plasticity

Henry Quach et al. Nat Commun. .

Abstract

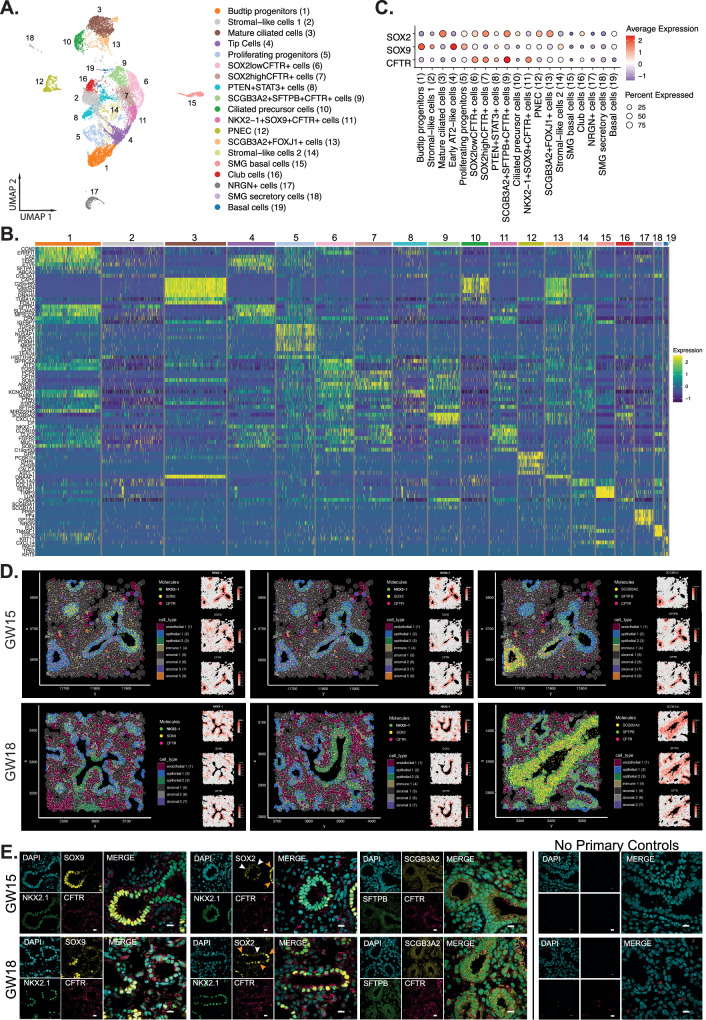
Studying human fetal lungs can inform how developmental defects and disease states alter the function of the lungs. Here, we sequenced >150,000 single cells from 19 healthy human pseudoglandular fetal lung tissues ranging between gestational weeks 10-19. We capture dynamic developmental trajectories from progenitor cells that express abundant levels of the cystic fibrosis conductance transmembrane regulator (CFTR). These cells give rise to multiple specialized epithelial cell types. Combined with spatial transcriptomics, we show temporal regulation of key signalling pathways that may drive the temporal and spatial emergence of specialized epithelial cells including ciliated and pulmonary neuroendocrine cells. Finally, we show that human pluripotent stem cell-derived fetal lung models contain CFTR-expressing progenitor cells that capture similar lineage developmental trajectories as identified in the native tissue. Overall, this study provides a comprehensive single-cell atlas of the developing human lung, outlining the temporal and spatial complexities of cell lineage development and benchmarks fetal lung cultures from human pluripotent stem cell differentiations to similar developmental window.


Conflict of interest statement

All authors declare no competing interests.

Figures

Fig. 1
Fig. 1. Overview of the single-cell RNA sequencing dataset from 19 fetal lung tissues.
A Biological sex of the lungs was determined by SRY, XIST, and DDX3Y expression. The graphical image was created with Biorender.com. B UMAP visualization of the dataset highlighting the main cell types: stromal, epithelial, endothelial, immune, and Schwann cells. C Gene expression heatmap of the top 5 differentially expressed genes in each cell type. D UMAP projection of all 58 cell types/states identified within the integrated dataset. E Proportion of the major cell types across all gestational weeks. F Integrated UMAP projection of three published fetal lung datasets of similar developmental time points (He et al., Sountoulidis et al., and Cao et al., in gray) overlayed with our dataset (red). Source data are provided as a Source Data file.
Fig. 2
Fig. 2. Characterization of the stromal cell compartment identifies lipofibroblast and lipofibroblast progenitors as main cell type in the developing fetal lungs.
A UMAP visualization of the fetal stromal cell subtypes. B Proportion of stromal cell subtypes across gestational week. C Gene expression heatmap of DEGs representing each cell subtype. D Heatmap measuring regulon activity of the top differentially expressed transcription factors (TF) genes based on regulon specificity score (RSS) via SCENIC. E Xenium spatial plots of EGR1, ATF3, IRF1 in lipofibroblasts, TCF21 and MACF1 in lipofibroblast precursors, and SERPINF1, FBN1, IGFBP5 in airway fibroblast progenitors. Colors in (B) indicate cell type as in (A). Numbers in the top bar of (C) and (D) indicate cell type as in (A). Source data are provided as a Source Data file.
Fig. 3
Fig. 3. Trajectory analysis of the stromal cell compartment show derivation of lipofibroblasts and airway fibroblast progenitors.
A LatentVelo analysis revealing inferred cell state trajectories (arrows) projected onto the UMAP. B Partition-based graph abstraction (PAGA) plot identified lineage trajectories informed by LatentVelo velocities. Line thickness indicates inferred transition strength. C Slingshot trajectory analysis with a root at cycling fibroblasts identifies a trajectory to lipofibroblasts (UMAP colored by pseudotime, dark blue to yellow). The trajectory heatmap plot shows the progression of cell types along the trajectory and the change in significantly varying genes. D Slingshot trajectory analysis with a root at cycling fibroblasts identifies a trajectory to airway fibroblast progenitors (UMAP colored by pseudotime, dark blue to yellow). Numbers and colors in (B) indicate cell type as in (A). Source data are provided as a Source Data file.
Fig. 4
Fig. 4. Spatial identification of CFTR-expressing progenitor cells identified in the developing fetal lung epithelium.
A UMAP visualization of the fetal epithelial subtypes. B Gene expression heatmap of DEGs representing each cell subtype. C Dotplot of average scaled gene expression for CFTR, SOX9, and SOX2 in each epithelial cell type. D Xenium spatial plots of CFTR, NKX2-1, SOX9, SOX2, SCGB3A2, SFTPB in the developing airways of GW15 (top row) and GW18 (bottom row) fetal lung tissues. E Immunofluorescence staining shows the localization of NKX2-1, SOX2, SOX9, CFTR SCGB3A2, and SFTPB positive cells in GW15 (top row) and GW18 (bottom row) fetal lung tissues. At least 4 representative images were captured and analyzed for each gestational time point. The Right column panels are negative controls (no primary, secondary antibodies only). DAPI marks all nuclei. White arrowheads and orange arrowheads demarcate areas of SOX2low and SOX2high cells, respectively. Scale bar = 10 microns. Numbers in the top bar of (B) indicate cell type as in (A). Source data are provided as a Source Data file.
Fig. 5
Fig. 5. Co-occurrence of epithelial and stromal cell types using low-resolution Visium and high-resolution Xenium spatial transcriptomics.
A Correlation between RCTD weights for Visium spots. Showing the colocalization of cell types within the same Visium spots. Hierarchical clustering shows groups of frequently colocalized cell types. B Xenium-informed RCTD neighborhood enrichment, showing cell types that frequently neighbor. Hierarchical clustering shows groups of frequently enriched neighbors. Source data are provided as a Source Data file.
Fig. 6
Fig. 6. RNA velocity analysis reveals dynamic epithelial cell trajectories varying across gestational ages.
A LatentVelo analysis revealing inferred cell state trajectories (arrows) projected onto the UMAP. B Terminal states are identified by using velocities with CellRank, shown on the UMAP. C Partition-based graph abstraction (PAGA) analysis reveals multiple connections with the fetal epithelia. Line thickness indicates inferred transition strength. D Analysis of cell type proportion over time (gestational weeks). Each point indicates a tissue sample. The best fit out of a constant, linear, or quadratic model is chosen for each cell type, shown with 95% credible intervals. E LatentVelo PAGA subset into Early (GW10-13), Mid (GW14–16), and Late (GW17-19). The weakening of PNEC transitions were observed, and the emergence of transitions to ciliated cells with increasing GW. F Based on the PAGA, the early trajectories to PNEC from TP cells are analyzed with Slingshot (UMAP colored by pseudotime, dark blue to yellow). Trajectory heatmaps show the progression of cell types (top colored bar) and significantly varying genes along the trajectory. List of GO, KEGG, and Reactome terms and pathways enriched in each gene cluster (row colors). Pathways are shown in text boxes for the cell type that most express the genes. G Mid-time point Slingshot trajectories highlighting the emergence of mature ciliated cells from TP cells are shown. H Based on PAGA, basal cells contribute to late club and PNEC cells. Slingshot trajectories show the development of PNEC cells from basal cells and the development of Club cells from basal and TP cells. Source data are provided as a Source Data file.
Fig. 7
Fig. 7. Regulation of TP cells differentiation and cell communication.
A Heatmap showing the gene-normalized expression of the top 20 differentially expressed genes for the PNEC and mature ciliated cells within the TP cells versus gestational week. B CellRank matures ciliated and PNEC fate probabilities for TP cells versus gestational week (distributions shown as violin plot). C Immunofluorescence staining for ASCL1 (PNEC marker, yellow) and FOXJ1 (ciliated cell marker, magenta) in GW12, 15, and 18 fetal lung tissues. At least 4 representative images were captured and analyzed for each gestational time point. The Right panel shows the negative controls (no primary or secondary antibodies only). Scale = 25 microns. D FGF signaling interaction probabilities towards TP cells from spatially neighboring cell types with significant FGF interactions. E Co-occurrence probability of deconvolved cell types within spatial neighborhoods of TP cells of a given radius with Xenium. F Significant ligand-receptor (L-R) interactions towards TP cells for the FGF pathway, subset to signaling cell types in proximity. Both color and point size indicate interaction probability. Red values show that L-R interactions significantly increased early. Blue values show interactions significantly increased mid/late. Significance is determined using a permutation test randomly permuting cell-type labels, significant interactions are chosen with p < 0.01. Source data are provided as a Source Data file.
Fig. 8
Fig. 8. Characterization of hPSC-derived fetal lung cells and organoids.
A Schematics of stage-specific differentiation of PSC towards mature proximal airway epithelia. A graphical image was created with Biorender.com. B UMAP projection of hPSC-derived fetal lung cells. C DEG overlaps between primary fetal cell types and hPSC fetal lung clusters. D UMAP projection of hPSC-derived fetal lung organoids. E DEG overlaps between primary fetal cell types and hPSC organoid clusters. F Spearman’s rank correlation coefficient (red to blue) analysis between hPSC-derived fetal lung models and primary-derived fetal lung epithelia and Travaglini et al. adult lung dataset using the top 50 DEG for each gestational week and adult lung. Source data are provided as a Source Data file.
Fig. 9
Fig. 9. hPSC-derived lung models recapitulate trajectories towards basal and CFTR-expressing cells from the fetal lung epithelia.
A Integrated UMAP projection of hPSC-derived fetal lung cells and organoids integrated with primary fetal lung epithelia. B Integrated UMAP projection of hPSC-derived fetal lung cells and organoids cells. C Inferred primary fetal trajectory (black line with arrow) from budtip progenitors to TP cells overlaid on the integrated UMAP embedding (UMAP colored by pseudotime, dark blue to yellow). D hPSC-derived clusters overlapped on integrated UMAP projection. E Cell type scores based on the top 100 DEGs from the primary fetal epithelia reveal high proliferating progenitor scores in the hPSC fetal lung cells and high basal scores in the hPSC organoids. Scores are normalized so that the median score for a cell of its own type is 1. hPSC clusters from left to right increase in average pseudotime. F Trajectory heat map showing the change in gene expression of hPSC fetal lung cells and organoids within these clusters, ordered by increasing average pseudotime of the primary fetal cells within each cluster. G LatentVelo analysis revealing inferred cell state trajectories (arrows) projected onto the UMAP for hPSC fetal lung cells. H LatentVelo analysis revealing inferred cell state trajectories (arrows) projected onto the UMAP for hPSC organoid cells. I Schematics of the inferred trajectory of hPSC-derived cell types found in the fetal lung cells and organoids along the differentiation path (arrow pointing upwards). Source data are provided as a Source Data file.
Fig. 10
Fig. 10. Graphical schematic of the spatial organization of epithelial and stromal cell types in the developing fetal lung.
A schematic of the spatial localization of the epithelial and stromal cell subtypes in the developing airways illustrating the spatiotemporal changes in the developing airways. The developing distal bud region is populated by undifferentiated progenitor cell types. As the proximal stalk region develops, proximal progenitors (located in regions between the bud and stalk) generate differentiated cells that populate the developing proximal epithelium with specialized epithelial cell types. Differentiation of the developing epithelia occurs along the distal (right) to the proximal (left) axis. Cell types were identified by scRNA-seq, and their spatial localization was defined by spatial transcriptomics and immunofluorescence staining. The graphical image was created with Biorender.com.

References

    1. Young MD, et al. Single-cell transcriptomes from human kidneys reveal the cellular identity of renal tumors. Science. 2018;361:594–599. doi: 10.1126/science.aat1699. - DOI - PMC - PubMed
    1. Baron M, et al. A single-cell transcriptomic map of the human and mouse pancreas reveals inter- and intra-cell population structure. Cell Syst. 2016;3:346–360.e4. doi: 10.1016/j.cels.2016.08.011. - DOI - PMC - PubMed
    1. Carraro G, et al. Transcriptional analysis of cystic fibrosis airways at single-cell resolution reveals altered epithelial cell states and composition. Nat. Med. 2021;27:806–814. doi: 10.1038/s41591-021-01332-7. - DOI - PMC - PubMed
    1. Travaglini KJ, et al. A molecular cell atlas of the human lung from single-cell RNA sequencing. Nature. 2020;587:619–625. doi: 10.1038/s41586-020-2922-4. - DOI - PMC - PubMed
    1. Vieira Braga FA, et al. A cellular census of human lungs identifies novel cell states in health and in asthma. Nat. Med. 2019;25:1153–1163. doi: 10.1038/s41591-019-0468-5. - DOI - PubMed

MeSH terms

Substances