. 2024 Jul 13;14(1):16178.
doi: 10.1038/s41598-024-67284-3.

The shared mechanism and potential diagnostic markers for premature ovarian failure and dry eye disease

Affiliations

The shared mechanism and potential diagnostic markers for premature ovarian failure and dry eye disease

Xi Long et al. Sci Rep. .

Abstract

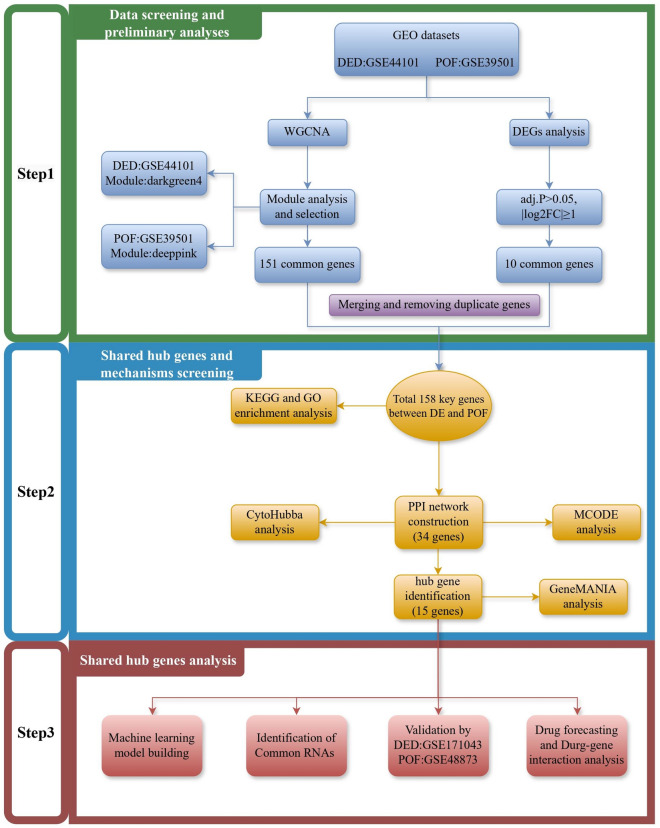
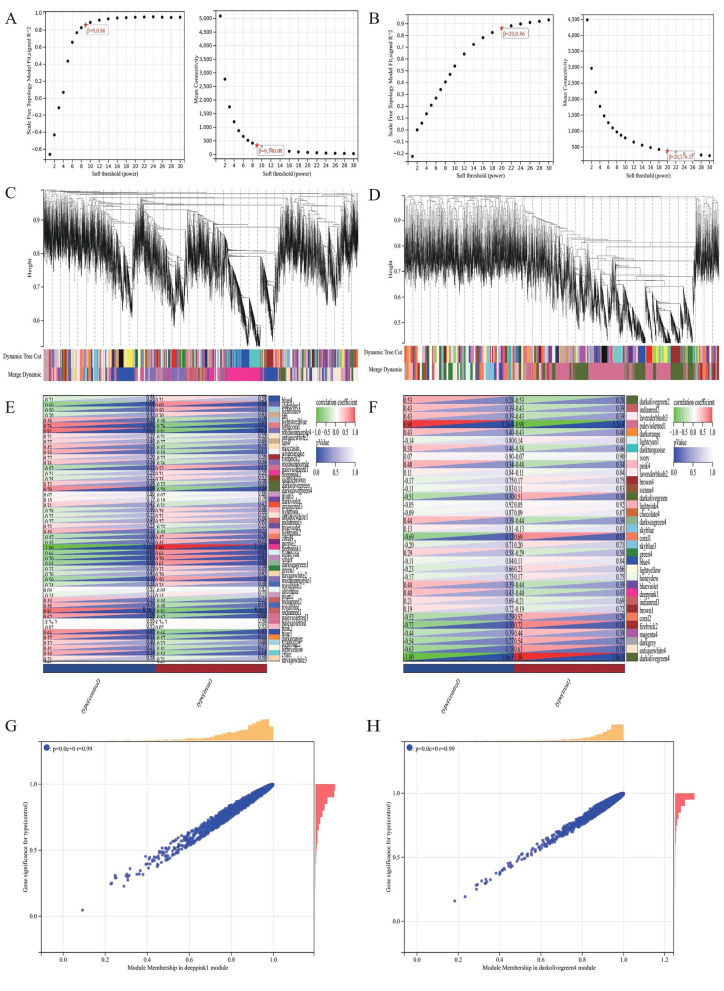
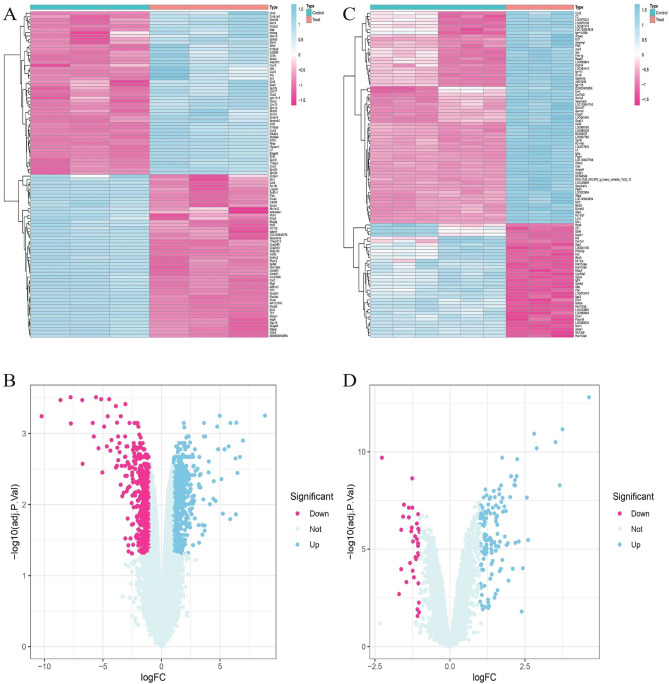
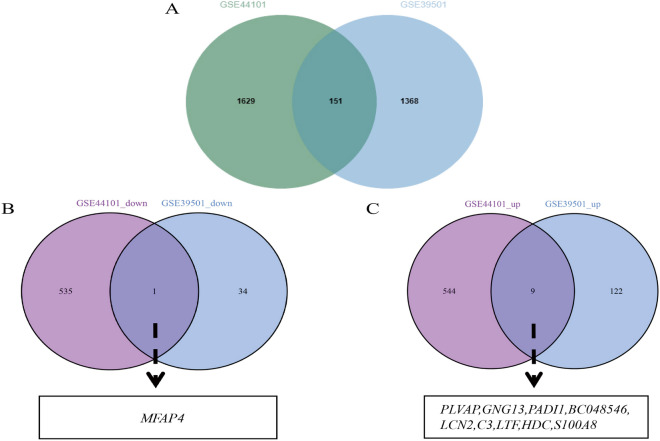
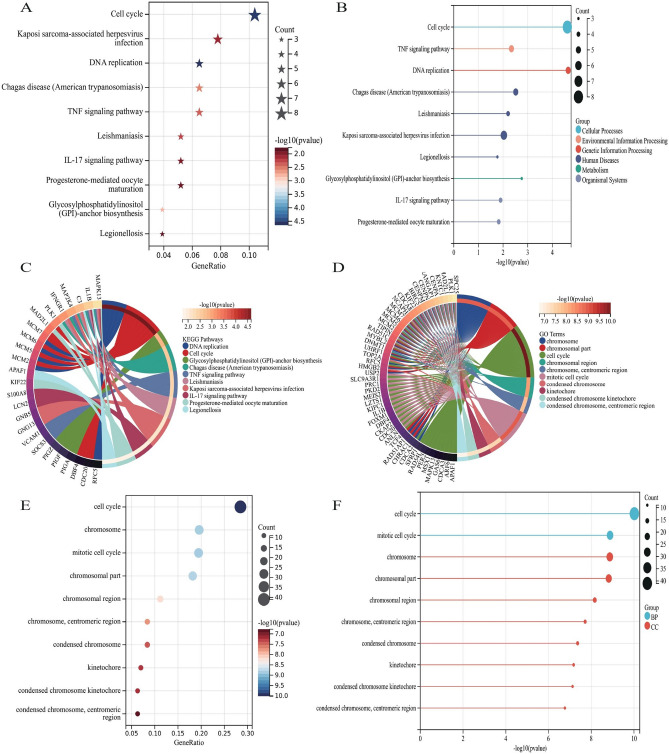
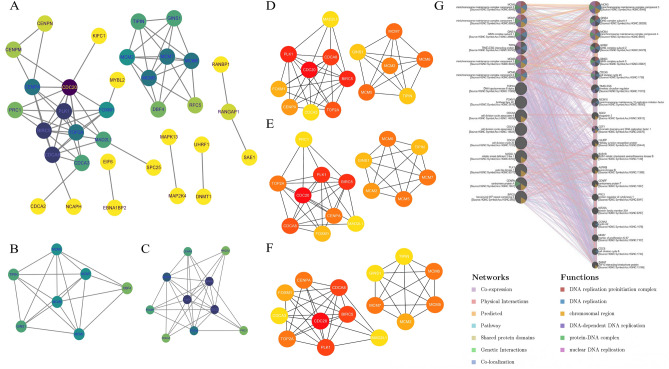
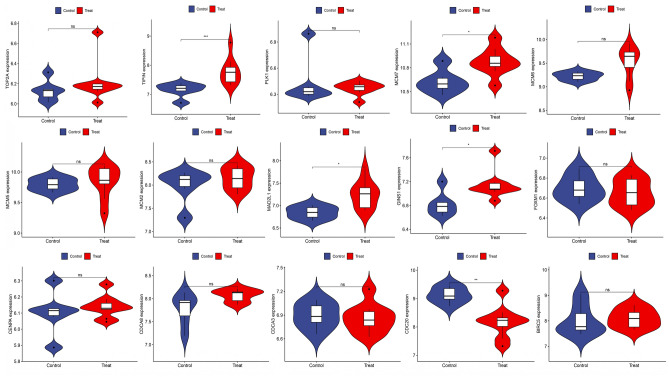
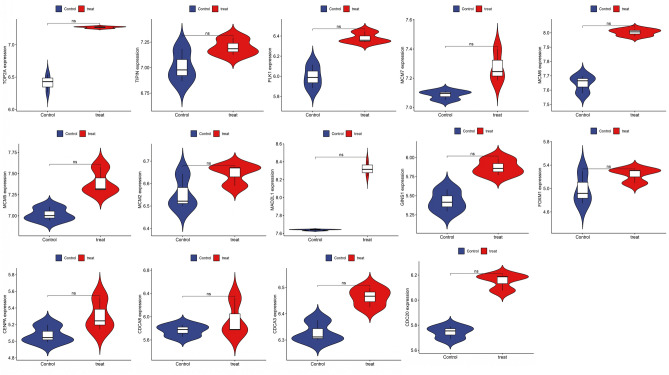
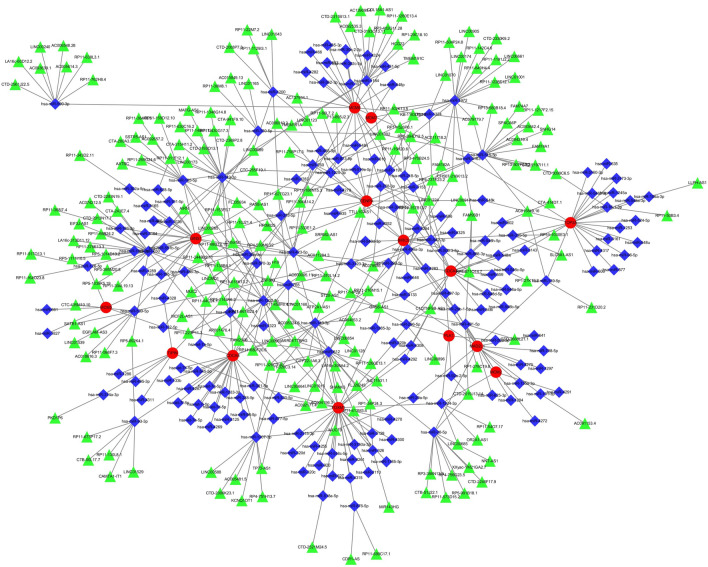
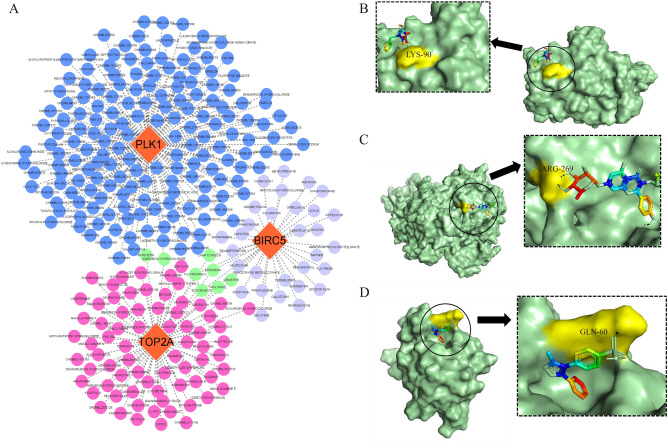
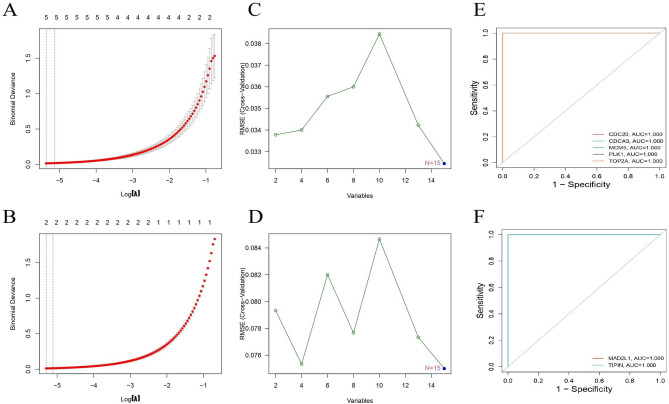
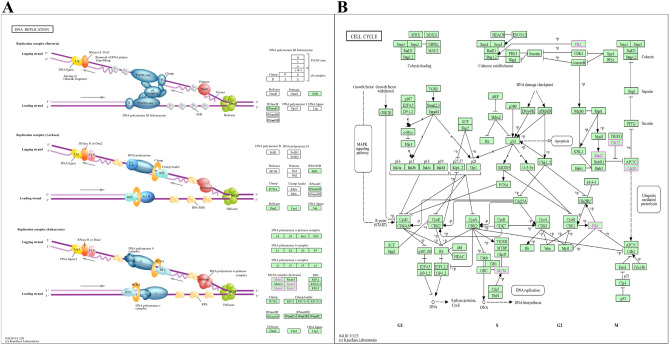
Premature ovarian failure (POF), which is often comorbid with dry eye disease (DED) is a key issue affecting female health. Here, we explored the mechanism underlying comorbid POF and DED to further elucidate disease mechanisms and improve treatment. Datasets related to POF (GSE39501) and DED (GSE44101) were identified from the Gene Expression Omnibus (GEO) database and subjected to weighted gene coexpression network (WGCNA) and differentially expressed genes (DEGs) analyses, respectively, with the intersection used to obtain 158 genes comorbid in POF and DED. Kyoto Encyclopedia of Genes and Genomes (KEGG) and Gene Ontology (GO) analyses of comorbid genes revealed that identified genes were primarily related to DNA replication and Cell cycle, respectively. Protein-Protein interaction (PPI) network analysis of comorbid genes obtained the 15 hub genes: CDC20, BIRC5, PLK1, TOP2A, MCM5, MCM6, MCM7, MCM2, CENPA, FOXM1, GINS1, TIPIN, MAD2L1, and CDCA3. To validate the analysis results, additional POF- and DED-related datasets (GSE48873 and GSE171043, respectively) were selected. miRNAs-lncRNAs-genes network and machine learning methods were used to further analysis comorbid genes. The DGIdb database identified valdecoxib, amorfrutin A, and kaempferitrin as potential drugs. Herein, the comorbid genes of POF and DED were identified from a bioinformatics perspective, providing a new strategy to explore the comorbidity mechanism, opening up a new direction for the diagnosis and treatment of comorbid POF and DED.

Keywords: Bioinformatics; Dry eye disease; Potential diagnostic markers; Premature ovarian failure; Shared mechanism.


Conflict of interest statement

The authors declare no competing interests.

Figures

Figure 1
Figure 1
Schematic diagram of the general flow of this research work. In order to gain a more penetrating understanding of the mechanisms of comorbidity between POF and DED, we began our research journey using data from the GEO database. Specifically, this study was divided into three main parts. Firstly, in the first part we identified the GSE44101 and GSE39501 datasets as the primary cohorts through a careful matching strategy, and identified the GSE171043 and GSE48873 datasets for validation. We performed WGCNA analysis on GSE44101 and GSE39501 to identify the key modules and module genes, followed by differential expression analysis, respectively. The 158 common genes of POF and DED were obtained by merging and removing duplicate genes. Subsequently, in the second part, in order to reveal the functional basis of these common key genes, we performed exhaustive GO and KEGG analyses. Meanwhile, in order to further screen the hub genes, we executed a set of step-by-step screening of 15 hub genes after covering PPI, MCODE, Cytoscape, and GeneMANIA analyses. In the third part, the hub genes were further analysed and validated through seamless integration with 4 different methods and 2 datasets. This comprehensive approach not only enriches our understanding of the mechanisms of POF and DED comorbidity, but also lays a solid foundation for identifying prospective targeted therapies and interventions for the treatment of POF and DED comorbidity.
Figure 2
Figure 2
Weighted Gene Co-expression Network Analysis. (A) Selection of soft thresholds (β) for WGCNA analysis of POF. (B) Selection of soft thresholds (β) for WGCNA analysis of DED. (C) This diagram shows the degree of correlation within the module of the POF dataset. (D) This diagram shows the degree of correlation within the module of the DED dataset. (E) Relationship between modules and clinical features in POF dataset. (F) Relationship between modules and clinical features in DED dataset. Rows represent different modules and columns represent clinical features. Each cell contains the correlation between modules and clinical features and the corresponding p-value. (G) Module membership in deeppink1 module in POF dataset. (H) Module membership in darkolivegrenn4 module in DED dataset.
Figure 3
Figure 3
Differentially expressed genes in POF and DED. (A) Volcano plot of differentially expressed genes in DED dataset, with pink representing up-regulated genes and blue representing down-regulated genes. (B) Heatmap of differentially expressed genes in DED dataset. Pink color represents high expression and blue color represents low expression. (C) Volcano plot of differentially expressed genes in POF dataset, with pink representing up-regulated genes and blue representing down-regulated genes. (D) Heatmap of differentially expressed genes in POF dataset. Pink color represents high expression and blue color represents low expression.
Figure 4
Figure 4
POF and DED co-morbidity-genes screening. (A) Intersecting WGCNA genes of POF and DED. Green color represents DED dataset and blue color represents POF dataset. (B) Intersecting down-regulated DEGs of POF and DED. Purple color represents DED dataset and blue color represents POF dataset. (C) Intersecting up-regulated DEGs of POF and DED. Purple color represents DED dataset and blue color represents POF dataset.
Figure 5
Figure 5
Enrichment analysis and Functional Annotation of comorbid genes between POF and DED. (A) Bubble diagram of KEGG enrichment analysis. (C) Histogram of KEGG enrichment analysis. (D) Circle diagram of KEGG enrichment analysis. (E) Bubble diagram of GO functional analysis. (F) Histogram of GO functional analysis. (G) Circle diagram of GO functional analysis.
Figure 6
Figure 6
Identifcation and analysis of hub genes. (A) Protein–protein interaction network from String10.0. The purpler the node represents its higher significance, the yellower it is the opposite. (B) Cluster 1 from MCODE analysis of key genes. (C) Cluster 2 from MCODE analysis of key genes. (D) Identifcation of hub genes by CytoHubba of MCC ranking method. (E) Identifcation of hub genes by CytoHubba of MNC ranking method. (F) Identifcation of hub genes by CytoHubba of Dgree ranking method. (G) Hub genes and their co-expression genes were analyzed by GeneMANIA.
Figure 7
Figure 7
Validation of hub genes expression by POF dataset (GSE48873).
Figure 8
Figure 8
Validation of hub genes expression by DED dataset (GSE171043).
Figure 9
Figure 9
miRNAs-lncRNAs shared genes network. Red circles are mrnas, blue quadrangles are miRNAs, and green triangles are lncRNAs.
Figure 10
Figure 10
Drug-gene interaction network and docking analysis. (A) Drug-gene interaction network. Orange circles represent genes, blue circles represent predictive drugs for PLK1, purple circles represent predictive drugs for BIRC5, pink circles represent predictive drugs for TOP2A, and green circles represent predictive drugs associated with tow genes. (B) The docking of BIRC5 with VALDECOXIB, the docking energe is − 5.51 kJ/mol. (C) The docking of PLK1 with AMORFRUTIN A, the docking energe is − 1.19 kJ/mol. (D) The docking of TOP2A with KAEMPFERITRIN, the docking energe is − 1.84 kJ/mol.
Figure 11
Figure 11
(A) Regression of the 15 shared genes using LASSO in GSE39501. (B) Regression of the 15 shared genes using SVM-RFE in GSE39501. (C) ROC of characteristic genes in GSE39501. (D) Regression of the 15 shared genes using LASSO in GSE44101. (B) Regression of the 15 shared genes using SVM-RFE in GSE44101. (C) ROC of characteristic genes in GSE44101.
Figure 12
Figure 12
The key signaling pathways. (A) DNA replication. (B) Cell cycle.

References

    1. Chon SJ, Umair Z, Yoon MS. Premature ovarian insufficiency: Past, present, and future. Front Cell Dev Biol. 2021;9:672890. doi: 10.3389/fcell.2021.672890. - DOI - PMC - PubMed
    1. Torrealday S, Kodaman P, Pal L. Premature Ovarian Insufficiency - an update on recent advances in understanding and management. F1000Res. 2017;6:2069. doi: 10.12688/f1000research.11948.1. - DOI - PMC - PubMed
    1. Kuchakzadeh F, Ai J, Ebrahimi-Barough S. Tissue engineering and stem cell-based therapeutic strategies for premature ovarian insufficiency. Regen Ther. 2023;25:10–23. doi: 10.1016/j.reth.2023.11.007. - DOI - PMC - PubMed
    1. Rodgers JL, et al. Cardiovascular risks associated with gender and aging. J. Cardiovasc. Dev. Dis. 2019;6(2):19. - PMC - PubMed
    1. Stefanowski B, et al. Cognitive decline and dementia in women after menopause: Prevention strategies. Maturitas. 2023;168:53–61. doi: 10.1016/j.maturitas.2022.10.012. - DOI - PubMed