. 2025 Jan;30(1):97-110.
doi: 10.1038/s41380-024-02663-w. Epub 2024 Jul 13.

A bipolar disorder-associated missense variant alters adenylyl cyclase 2 activity and promotes mania-like behavior

Affiliations

A bipolar disorder-associated missense variant alters adenylyl cyclase 2 activity and promotes mania-like behavior

Paromita Sen et al. Mol Psychiatry. 2025 Jan.

Abstract

The single nucleotide polymorphism rs13166360, causing a substitution of valine (Val) 147 to leucine (Leu) in the adenylyl cyclase 2 (ADCY2), has previously been associated with bipolar disorder (BD). Here we show that the disease-associated ADCY2 missense mutation diminishes the enzyme´s capacity to generate the second messenger 3',5'-cylic adenosine monophosphate (cAMP) by altering its subcellular localization. We established mice specifically carrying the Val to Leu substitution using CRISPR/Cas9-based gene editing. Mice homozygous for the Leu variant display symptoms of a mania-like state accompanied by cognitive impairments. Mutant animals show additional characteristic signs of rodent mania models, i.e., they are hypersensitive to amphetamine, the observed mania-like behaviors are responsive to lithium treatment and the Val to Leu substitution results in a shifted excitatory/inhibitory synaptic balance towards more excitation. Exposure to chronic social defeat stress switches homozygous Leu variant carriers from a mania- to a depressive-like state, a transition which is reminiscent of the alternations characterizing the symptomatology in BD patients. Single-cell RNA-seq (scRNA-seq) revealed widespread Adcy2 mRNA expression in numerous hippocampal cell types. Differentially expressed genes particularly identified from glutamatergic CA1 neurons point towards ADCY2 variant-dependent alterations in multiple biological processes including cAMP-related signaling pathways. These results validate ADCY2 as a BD risk gene, provide insights into underlying disease mechanisms, and potentially open novel avenues for therapeutic intervention strategies.


Conflict of interest statement

Competing interests: The authors declare no competing interests. Ethics approval: All animal experiments were conducted with the approval of and in accordance with the Guide of the Care and Use of Laboratory Animals of the Government of Upper Bavaria, Germany.

Figures

Fig. 1
Fig. 1. Consequences of Val147Leu substitution on ADCY2 activity and subcellular localization.
a Organization of human ADCY2 gene and localization of BD-associated SNPs rs17826816 and rs13166360. b rs13166360 causes a Val147 Leu substitution in the 4th transmembrane helix (TM4) of the first transmembrane domain (M1). c Alignment of TM4 and adjacent regions of human and murine ADCY2 with human membrane bound ADCY paralogues. d Quantification and representative Western blot showing expression levels of ADCY2-V151, ADCY2-L151 and ADCY2-N1030A/R1034S in transiently transfected HEK293 cells (n = 3). e Forskolin (FSK) concentration-dependent stimulation of cAMP production by ADCY2 variants compared to the catalytically inactive variant ADCY2-N1030A/R1034S (n = 3; two-way ANOVA, ADCY2 variants: F(1,14) = 127.6, ****p < 0.0001, concentration: F(6,14) = 207.9, p < 0.0001, variants × concentration: F(6,14) = 20.18, p < 0.0001). f Time course of cAMP production of ADCY2 variants at baseline and following repeated FSK stimulation (n = 3; two-way ANOVA repeated measures, ADCY2 variants: F(2,3) = 98.37, **p = 0.0018, time: F(2,7) = 301, p < 0.0001, variants × time: F(12,18) = 22.17, p < 0.0001). Quantification of co-localization of HA-tagged ADCY2-V151 and HA-tagged ADCY2-L151 with: (g) FLAG-tagged ADCY2-L151, (h) RFP-tagged Rab5, GFP-tagged Rab7, Rab9, RAB11, (i) endogenous Rab5 and (j) phalloidin using Mander’s co-localization co-efficient. In all comparisons, unpaired t test, ****p < 0.0001. Each dot represents an individual cell. All data are presented as mean ± s.e.m..
Fig. 2
Fig. 2. Generation of Adcy2V151L mice.
a Organization of the murine Adcy2 gene. b CRISPR/Cas9-based strategy targeting exon 3 using sgRNAs sgAdcy2-a and sgAdcy2-b in combination with a ssODN to replace Val by Leu at position 151. c Representative electropherograms depicting possible genotypes of offspring from heterozygous breedings. d Quantification of Adcy2 mRNA expression in the cortex of WT and L151 mice (n = 5 each) by RT-qPCR. e Representative electropherograms of Adcy2 cDNA from WT and L151 mice covering the transition from exon 2 (E2) to exon 3 (E3). Highlighted are the AluI restriction site and the Val151Leu substitution present in L151 mice.
Fig. 3
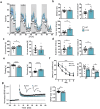
Fig. 3. Behavioral assessment of L151 mice reveals signs of mania-like behavior and cognitive deficits.
a Locomotor activity during adaptation to a novel home cage (WT n = 8, L151 n = 9; two-way ANOVA repeated measures, 1st dark phase: genotype: F(1,15) = 4.748, *p = 0.0457, time: F(2, 32) = 5.468, p = 0.006, genotype × time: F(9,120) = 0.8536, p = 0.5687; 2nd dark phase: genotype: F(1,14) = 5.215, *p = 0.0385, time: F(5,75) = 12.54, p < 0.0001, genotype × time: F(11,154) = 0.9820, p = 0.4652). b Distance traveled, number of entries into (unpaired t test, *p = 0.0199) and time spent in the inner zone (unpaired t test, *p = 0.035) of the open field test. c Time spent in and number of entries into the lit zone of the dark-light box (unpaired t test, *p = 0.0344). d Exploration of the object (unpaired t test, *p = 0.0227) and object zone entries (unpaired t test, Tp = 0.087) in the novel object exploration test (b–d: WT n = 16, L151 n = 13). e Time spent floating and swimming in the forced swim test (WT n = 16, L151 = 12; unpaired t test, floating and swimming time: p < 0.0001 for both). f Latency to find the platform in the Morris water maze test (WT n = 10, L151 n = 9; two-way ANOVA repeated measures, genotype: ***p = 0.0003, F(1,17) = 20.33, Bonferroni multiple comparisons test: day 2: *p = 0.0478, day 3: *p = 0.0187) and time spent in the target quadrant during memory retrieval (unpaired t test, *p = 0.0325). g LTP at CA3-CA1 synapses in dorsal hippocampal slices from WT and L151 mice (n = 17 slices from 5 WT mice and 18 slices from 5 L151 mice; unpaired t test, *p = 0.0298). Representative recording traces depict fEPSPs before and 60 min after LTP induction. All data are presented as mean ± s.e.m..
Fig. 4
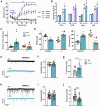
Fig. 4. L151 mice show amphetamine hypersensitivity, lithium chloride responsiveness and a shift towards more synaptic excitation.
a Locomotor activity following amphetamine treatment (WT n = 11, L151 n = 9; one-way ANOVA repeated measures, genotype: F(3,7) = 8.1386, **p = 0.0014). b Assessment of dopamine content in the prefrontal cortex (PFC), striatum (STR), nucleus accumbens (NAc) and hippocampus (HIP) following amphetamine treatment (WT n = 3; L151 n = 3; two-way ANOVA; PFC: genotype: F(1,21) = 6.167, p = 0.0091, treatment: F (1,21) = 21.63, p < 0.001, genotype × treatment: p = 23.514; STR: genotype: F(1,21) = 8.914, p = 0.0141, treatment: F(1,21) = 13.615, p = 0.010, genotype × treatment: F(1,21) = 21.631, p = 0.017; NAc: genotype: F(1,22) = 9.762, p = 0.610, treatment: F(1,22) = 12.218, p = 0.012, genotype × treatment: F(1,22) = 21.426, p = 0.047; HIP: genotype: F(1,21) = 10.21, p = 0.0493, treatment: F(1,21) = 6.514, p = 0.0121, genotype × treatment: F(1,21) = 11.426, p = 0.0521). c, d Behavioral assessment of WT and L151 mice following 2 weeks of LiCl treatment (WT control n = 8, L151 control n = 10, WT LiCl n = 9, L151 LiCl n = 10). c Time spent in the inner zone of the open field test (two-way ANOVA, genotype: F(1,31) = 8.641, p = 0.0062, treatment: F(1,31) = 6.763, p = 0 .0141, genotype × treatment: F(1,31) = 13.29, p = 0.001). d Time spent floating (two-way ANOVA, genotype: F(1,33) = 4.530, p = 0.0409, treatment: F(1,33) = 0.1745, p = 0.6788, genotype × treatment: F(1,33) = 324.1, p < 0.0001) and swimming (two-way ANOVA, genotype: F(1,33) = 169.4, p = 0.0409, treatment: F(1,33) = 0.1745, p = 0.6788, genotype × treatment: F(1,33) = 169.4, p < 0.000) in the forced swim test. e Representative traces, (f) amplitude and (g) frequency (unpaired t test, p = 0.0108) of patch-clamp recordings in the ventral hippocampus of miniature excitatory postsynaptic currents (mEPSCs; WT: n = 5 mice, 19 cells; L151: n = 4 mice, 22 cells). h Representative traces, (i) amplitude and (j) frequency (unpaired t test, p = 0.0005) of patch-clamp recordings in the ventral hippocampus of miniature inhibitory postsynaptic currents (mIPSCs; WT: n = 4 mice, 37 cells; L151: n = 4 mice, 32 cells). Bonferroni post hoc tests in (bd): Tp = 0.0531, *significantly different from WT of the same condition, p < 0.05; #significantly different from the basal condition of the same genotype, p < 0.05. All data are presented as mean ± s.e.m..
Fig. 5
Fig. 5. L151 mice show a switch in their behavioral state in response to chronic social defeat stress.
a–c Validation of efficiency of chronic social defeat stress (CSDS) paradigm. Adrenal weight (a) (two-way ANOVA, stress: F(1,45) = 99.06, p < 0.001), thymus weight (b) (two-way ANOVA, stress: F(1,45) = 76.27, p < 0.001) and social avoidance ratio (c) (two-way ANOVA, stress: F(1,47) = 43.88, p < 0.0001) of AdcyV151L mice subjected to the CSDS. Distance traveled (d) (two-way ANOVA, stress: F(1,49) = 24.33, p < 0.001), time spent in the inner zone (e) (two-way ANOVA, genotype: F(1,48) = 32.97, p < 0.001, stress: F(1,48) = 23.88, p < 0.001, genotype × stress: F(1,48) = 19.02, p < 0.001) and entries to the inner zone (f) (two-way ANOVA, genotype: F(1,50) = 11.56, p = 0.0013, stress: F(1,50) = 19.72, p < 0.001, genotype × stress: F(1,50) = 10.25, p = 0.0024) of the open field. g Time spent in the lit zone of the dark-light box (two-way ANOVA, genotype: F(1,47) = 0.6375, p = 0.4286, stress: F(1,47) = 1.142, p = 0.2906, genotype × stress: F(1,47) = 10.73, p < 0.002). Time spent floating (h) (two-way ANOVA, genotype: F(1,48) = 2.437, p = 0.1250, stress: F(1,48) = 39.05, p < 0.001, genotype × stress: F(1,48) = 34.55, p < 0.001) and swimming (i) in the forced swim test (two-way ANOVA, genotype: F(1,48) = 2.972, p = 0.0912, stress: F(1,48) = 33.15, p < 0.001, genotype × stress: F(1,48) = 40.31, p < 0.0001). Groups: WT basal n = 16-17, L151 basal n = 10–14, WT stressed n = 10–15, L151 stressed n = 9–11. Bonferroni post hoc tests in (a-i): p < 0.05. *significantly different from WT of the same condition, p < 0.05; #significantly different from the basal condition of the same genotype. All data are presented as mean ± s.e.m..
Fig. 6
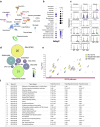
Fig. 6. Single cell RNA sequencing of the ventral hippocampus of Adcy2V151L mice.
a Dimensionality reduction Uniform Manifold Approximation and Projection (UMAP) plot showing 33 clusters belonging to 17 main cell types. b Expression of ADCY2 in various cell types of the ventral hippocampus. c Violin plots comparing ADCY2 expression in different cell types of the ventral hippocampus of WT and L151 mice. d Number of differentially expressed genes between L151 and WT cells in various cell types. e Gene ontology functional enrichment analysis using Kyoto Encyclopedia of Gene and Genome (KEGG) biological pathways. f List of significantly enriched KEGG terms.

Similar articles

Cited by

References

    1. Ferrari AJ, Stockings E, Khoo JP, Erskine HE, Degenhardt L, Vos T, et al. The prevalence and burden of bipolar disorder: findings from the Global Burden of Disease Study 2013. Bipolar Disord. 2016;18:440–450. - PubMed
    1. Vieta E, Berk M, Schulze TG, Carvalho AF, Suppes T, Calabrese JR, et al. Bipolar disorders. Nat Rev Dis Primers. 2018;4:18008. - PubMed
    1. Uher R. Gene-environment interactions in severe mental illness. Front Psychiatry. 2014;5:48. - PMC - PubMed
    1. Gordovez FJA, McMahon FJ. The genetics of bipolar disorder. Mol Psychiatry. 2020;25:544–559. - PubMed
    1. Fabbri C. The Role of Genetics in Bipolar Disorder. Curr Top Behav Neurosci. 2021;48:41–60. - PubMed