. 2024 Jul 23;43(7):114494.
doi: 10.1016/j.celrep.2024.114494. Epub 2024 Jul 13.

PP2A-B55 phosphatase counteracts Ki-67-dependent chromosome individualization during mitosis

Affiliations

PP2A-B55 phosphatase counteracts Ki-67-dependent chromosome individualization during mitosis

María Sanz-Flores et al. Cell Rep. .

Abstract

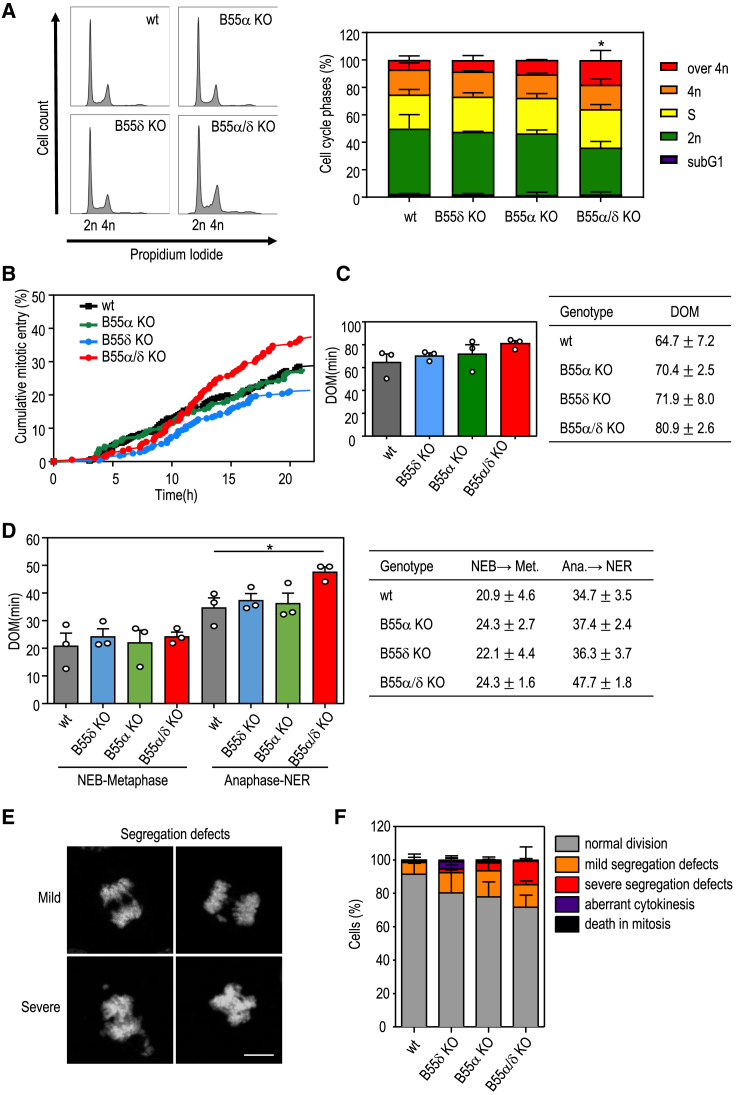
Cell cycle progression is regulated by the orderly balance between kinase and phosphatase activities. PP2A phosphatase holoenzymes containing the B55 family of regulatory B subunits function as major CDK1-counteracting phosphatases during mitotic exit in mammals. However, the identification of the specific mitotic roles of these PP2A-B55 complexes has been hindered by the existence of multiple B55 isoforms. Here, through the generation of loss-of-function genetic mouse models for the two ubiquitous B55 isoforms (B55α and B55δ), we report that PP2A-B55α and PP2A-B55δ complexes display overlapping roles in controlling the dynamics of proper chromosome individualization and clustering during mitosis. In the absence of PP2A-B55 activity, mitotic cells display increased chromosome individualization in the presence of enhanced phosphorylation and perichromosomal loading of Ki-67. These data provide experimental evidence for a regulatory mechanism by which the balance between kinase and PP2A-B55 phosphatase activity controls the Ki-67-mediated spatial organization of the mass of chromosomes during mitosis.

Keywords: B55; CP: Cell biology; CP: Molecular biology; Ki-67; PP2A; PPP2R2A; PPP2R2D; cell division; chromosome clustering; chromosome periphery; mitosis; phosphatase.


Conflict of interest statement

Declaration of interests The authors declare no competing interests.

Figures

None
Graphical abstract
Figure 1
Figure 1
Effect of Ppp2r2a and Ppp2r2d deletion on mouse viability and cell proliferation (A) Phylogenetic tree of the four B55 mouse isoforms. (B) Number (and percentage) of live mice obtained with the indicated genotypes from Ppp2r2a(+/−) and Ppp2r2d(+/−) heterozygous intercrosses, respectively. (C) Western blot analysis of MEFs with the indicated genotypes, using B55-isoform specific antibodies. Two clones of each genotype are shown. β-Actin was used as a loading control. An asterisk denotes an additional band detected with this antibody, either unspecific or from cross-reaction with another B55 isoform. (D) Schematic of the MEF cell lines and genotypes used in this study. (E and F) Transduction with Cre-expressing adenoviruses results in the depletion of Ppp2r2a compared to either control WT cells (E) or Ppp2r2d(−/−) cells (F) transduced with adenoviral vectors expressing Flp recombinases. Representative western blots for B55α and B55δ in one clone of each genotype are shown. Vinculin was used as a loading control. (G) Relative cell proliferation of B55α KO (Ppp2r2a(Δ/Δ), B55δ KO (Ppp2r2d(−/−), and B55α/δ KO (Ppp2r2a(Δ/Δ); Ppp2r2d(−/−) MEFs compared to WT cells (n = 3 biological replicates; 3 independent clones were analyzed per genotype). Data are represented as mean ± SEM for each time point. p < 0.05, ∗∗p < 0.01 (2-way ANOVA). See also Figure S1.
Figure 2
Figure 2
Mitotic defects in Β55α/δ-deficient cells (A) Cell cycle profile (propidium iodide) of one representative Ppp2r2a(lox/lox) clone and one representative Ppp2r2a(lox/lox); Ppp2r2d(−/−) clone 6 days after infection with AdenoFlp (WT, B55δ KO) or AdenoCre (B55αKO, B55α/δ KO) viruses. Bars on the right show the percentage of cells in each cell cycle phase for each genotype. (B) Videomicroscopy analysis of mitotic entry (scored by cell rounding and chromosome condensation) in B55α KO, B55δ KO, and B55α/δ KO cells compared with WT cells. n = 2 biological replicates, each one in a different clone (2 independent clones analyzed per genotype). (C) Overall duration of mitosis (DOM) in WT, B55α KO, B55δ KO, and B55α/δ KO MEFs. The table shows the numerical values of the mean ± SEM per genotype. (D) DOM from NEB until metaphase and from anaphase onset until mitotic exit (flattening of daughter cells) in WT, B55α KO, B55δ KO, and B55α/δ KO MEFs. The table shows the numerical values of the mean ± SEM per genotype. (E) Representative images (DAPI) of mitotic cells showing mild and severe chromosome segregation defects. Scale bar, 10μm. (F) Quantification of mitotic defects detected in WT, B55α-deficient, B55δ-deficient, and double KO B55α/δ-deficient MEFs. Data in (A), (C), (D), and (F) are means + SEM of 3 biological replicates, each one in a different clone (3 independent clones analyzed per genotype). ns, not significant; p < 0.05, 1-way ANOVA. See also Figure S2.
Figure 3
Figure 3
Chromosome scattering induced by deletion of B55 and nocodazole treatment (A) Representative images of H2B-RFP cells treated with nocodazole, showing a clustered prometaphase (top) and a prometaphase with scattered chromosomes (bottom), indicated by white arrowheads. (B) Percentage of prometaphase-arrested cells with scattered chromosomes in the indicated genotypes after nocodazole (0.8 μM) treatment. Data are means ± SEM of 3/4 biological replicates, each one in a different clone (3 or 4 independent clones analyzed per genotype). p < 0.05, ∗∗p < 0.01, ∗∗∗p < 0.001, one-way ANOVA. (C) Quantification of the mitotic exit cell fates (exit from mitosis as mononucleated cell, as multinucleated cell, or death during mitosis; see D for representative images) observed in the presence of nocodazole in each genotype. Data are means ± SEM of 3/4 biological replicates, each one in a different clone (3 or 4 independent clones analyzed per genotype). p < 0.05, ∗∗p < 0.01, ∗∗∗p < 0.001, two-way ANOVA. (D) Representative time-lapse images of H2B-RFP cells exiting from mitosis in the presence of nocodazole as a mononucleated cell (top), as multinucleated cells (center), or dying during the mitotic arrest (bottom). (E) Representative images of multinucleated cells stained with DAPI (blue) and α-tubulin (red), detected in WT and B55δ KO cells after nocodazole treatment. Scale bar, 10 μm. (F) Quantification of the number of nuclei per multinucleated cell in WT and B55δ KO cells after nocodazole treatment. Data are means ± SD of each clone (n = 1 biological replicate per clone, 3 clones analyzed per genotype). p < 0.05, Student’s t test. Scale bars: 10 μm. See also Figure S3.
Figure 4
Figure 4
Effect of B55 depletion on chromosome separation and Ki-67 accumulation in prometaphase (A) Representative images (DAPI) of WT and B55δ KO nocodazole-arrested cells. The graph shows the quantification of the total chromosome area per cell. Data are means ± SD of each clone (n = 1 biological replicate per clone, 3 clones analyzed per genotype). p < 0.05, Student’s t test. (B) Immunofluorescence images of metaphase spread, showing Ki-67 staining and DAPI in WT and B55δ KO cells. The graph shows the quantification of Ki-67 intensity per chromosome in at least 3 metaphase spreads/clone (n = 3 technical replicates). ∗∗∗p < 0.001, Student’s t test. Line scan analysis of Ki-67 and DAPI intensity per chromosome width is also shown on the right. Data show the average intensity ± SEM of 3 metaphase spreads per clone (10 sections were analyzed in each prometaphase). (C) Immunofluorescence images of prometaphases showing phospho-Ki-67 staining and DAPI in WT and B55δ KO cells. The graph shows the quantification of phospho-Ki-67 intensity normalized per DAPI in at least 10 cells per genotype (n = 10 technical replicates). Data are normalized to the WT condition. p < 0.05, Student’s t test. Scale bars, 10 μm.
Figure 5
Figure 5
The chromosome scattering phenotype of B55 KO cells is Ki-67 dependent (A) Representative immunofluorescence images of WT MEFs transfected with a siRNA control (Ctrl) or a siRNA against Ki-67. Ki-67 (red) and DAPI (blue) staining is shown. Scale bar, 10 μm. (B) Quantification of the total Ki-67 intensity per cell in nocodazole-arrested prometaphase in WT and B55δ KO cells transfected either with siRNA control or siRNA against Ki-67. Data are means ± SD of one representative clone per genotype and normalized to the control condition in WT cells. ∗∗∗p < 0.001, 1-way ANOVA. (C) Percentage of prometaphase-arrested cells with scattered chromosomes in the indicated genotypes after siRNA transfection and nocodazole (0.8 μM) treatment. Data are mean +SEM of 2/3 biological replicates, each one in a different clone (2 or 3 independent clones analyzed per genotype). p < 0.05, Student’s t test. (D) Quantification of the mitotic exit cell fates (exit from mitosis as mononucleated cell, as multinucleated cell, or death during mitosis) observed in the presence of nocodazole in the indicated genotypes after siRNA transfection. Data are means + SEM of 2/3 biological replicates, each one in a different clone (2 or 3 independent clones analyzed per genotype). ∗∗p < 0.01, two-way ANOVA. See also Figure S4.
Figure 6
Figure 6
Effect of B55 depletion on chromosome individualization in nocodazole-treated HeLa cells (A) Western blot analysis of HeLa cells transfected with the indicated siRNAs, using B55 isoform-specific antibodies. Vinculin was used as a loading control. (B) Representative images (DAPI) of control (siScramble) and B55δ-depleted (siPPP2R2D) nocodazole-arrested cells. The graph shows the percentage of prometaphase-arrested cells with scattered chromosomes upon transfection with the indicated siRNAs and nocodazole (0.8 μM) treatment for 14 h. Data are means + SD of one representative experiment. p < 0.05, 1-way ANOVA. Scale bar, 10 μm. (C) Quantification of the total chromosome area per cell. Data are means ± SD of one representative experiment. ∗∗∗p < 0.001, Student’s t test. (D) Representative immunofluorescence images of HeLa cells transfected with a siRNA ctrl or a siRNA against PPP2R2D. Ki-67 and DAPI staining is shown. The graph shows the quantification of the mean Ki-67 intensity per cell in nocodazole-arrested prometaphase normalized to the control condition in WT cells. Data are means ± SD of one representative experiment. ∗∗∗p < 0.001, Student’s t test. Scale bar, 10 μm. See also Figures S5–S7.

References

    1. Morgan D.O. Cyclin-dependent kinases: engines, clocks, and microprocessors. Annu. Rev. Cell Dev. Biol. 1997;13:261–291. doi: 10.1146/annurev.cellbio.13.1.261. - DOI - PubMed
    1. Crncec A., Hochegger H. Triggering mitosis. FEBS Lett. 2019;593:2868–2888. doi: 10.1002/1873-3468.13635. - DOI - PubMed
    1. Holder J., Poser E., Barr F.A. Getting out of mitosis: spatial and temporal control of mitotic exit and cytokinesis by PP1 and PP2A. FEBS Lett. 2019;593:2908–2924. doi: 10.1002/1873-3468.13595. - DOI - PubMed
    1. Mocciaro A., Schiebel E. Cdc14: a highly conserved family of phosphatases with non-conserved functions? J. Cell Sci. 2010;123:2867–2876. doi: 10.1242/jcs.074815. - DOI - PubMed
    1. Wurzenberger C., Gerlich D.W. Phosphatases: providing safe passage through mitotic exit. Nat. Rev. Mol. Cell Biol. 2011;12:469–482. doi: 10.1038/nrm3149. - DOI - PubMed

Publication types

LinkOut - more resources