. 2024 Jul 15;12(1):125.
doi: 10.1186/s40168-024-01840-x.

Redundancy in microbiota-mediated suppression of the soybean cyst nematode

Affiliations

Redundancy in microbiota-mediated suppression of the soybean cyst nematode

Muzammil Hussain et al. Microbiome. .

Abstract

Background: Soybean cyst nematodes (SCN) as animal parasites of plants are not usually interested in killing the host but are rather focused on completing their life cycle to increase population, resulting in substantial yield losses. Remarkably, some agricultural soils after long-term crop monoculture show a significant decline in SCN densities and suppress disease in a sustainable and viable manner. However, relatively little is known about the microbes and mechanisms operating against SCN in such disease-suppressive soils.

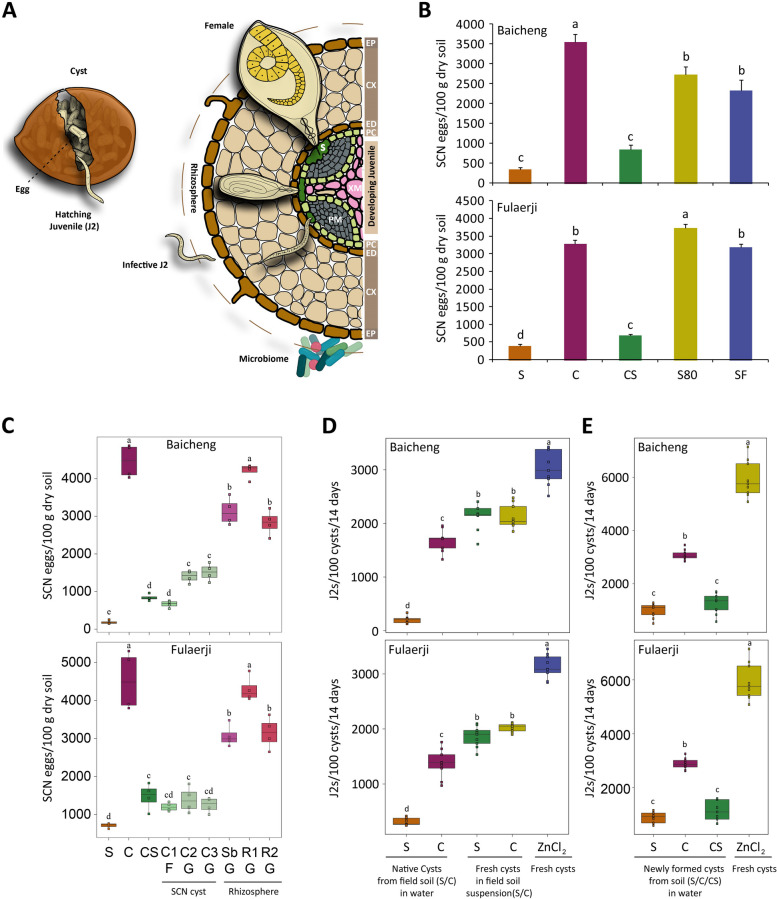
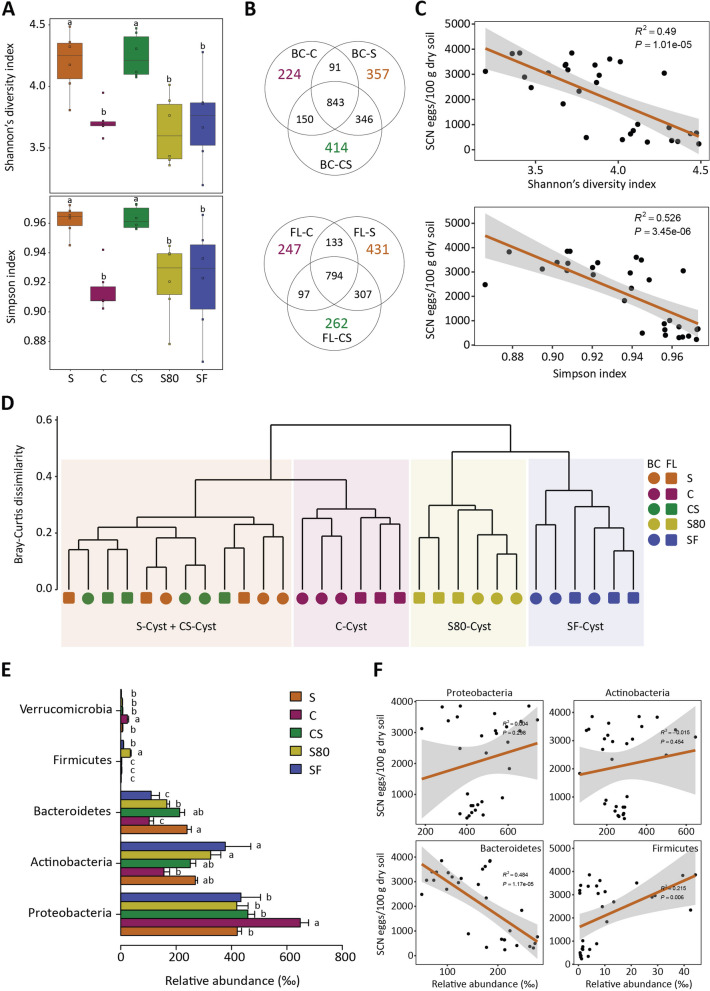
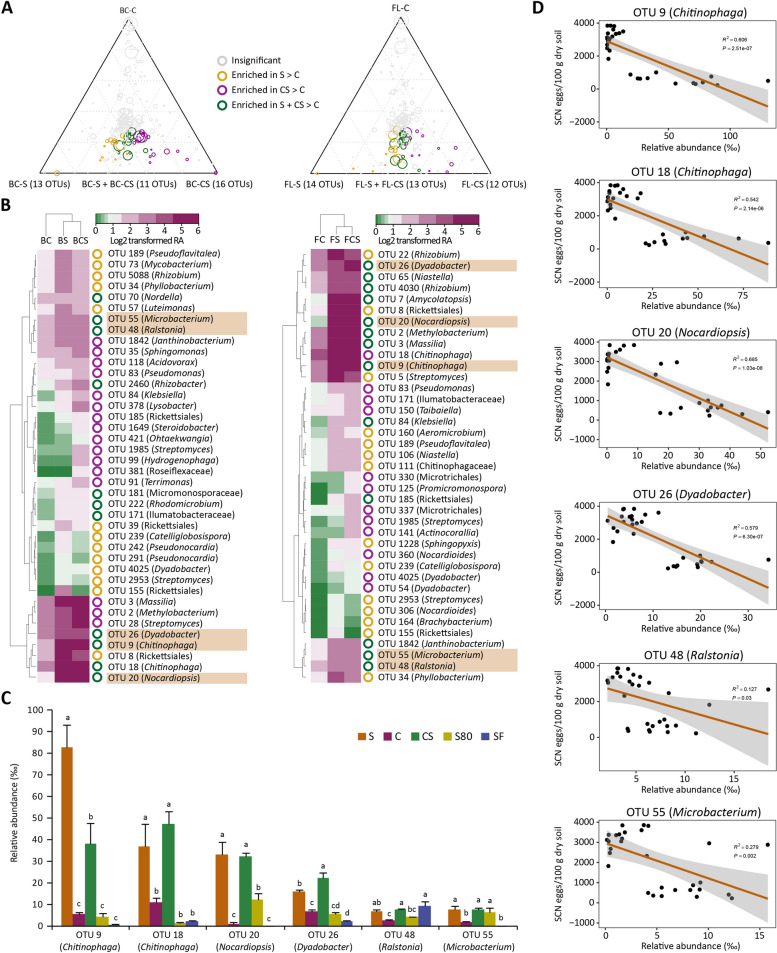
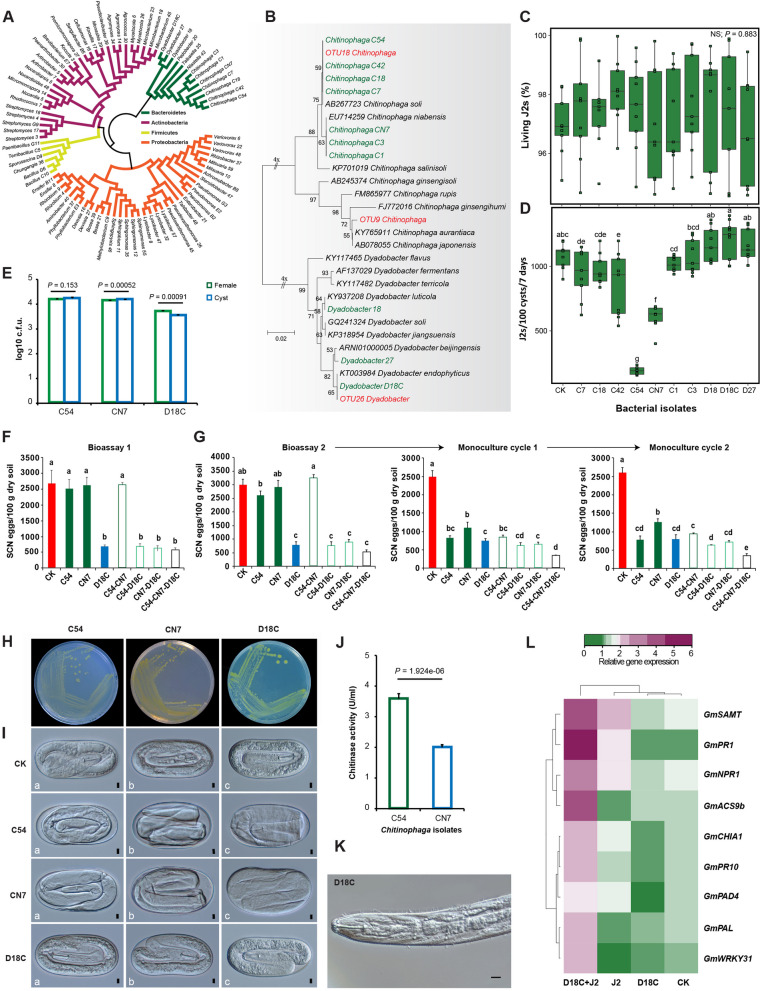
Results: Greenhouse experiments showed that suppressive soils (S) collected from two provinces of China and transplantation soils (CS, created by mixing 10% S with 90% conducive soils) suppressed SCN. However, SCN suppressiveness was partially lost or completely abolished when S soils were treated with heat (80 °C) and formalin. Bacterial community analysis revealed that the specific suppression in S and CS was mainly associated with the bacterial phylum Bacteroidetes, specifically due to the enrichment of Chitinophaga spp. and Dyadobacter sp., in the cysts. SCN cysts colonized by Chitinophaga spp. showed dramatically reduced egg hatching, with unrecognizable internal body organization of juveniles inside the eggshell due to chitinase activity. Whereas, Dyadobacter sp. cells attached to the surface coat of J2s increased soybean resistance against SCN by triggering the expression of defence-associated genes. The disease-suppressive potential of these bacteria was validated by inoculating them into conducive soil. The Dyadobacter strain alone or in combination with Chitinophaga strains significantly decreased egg densities after one growing cycle of soybeans. In contrast, Chitinophaga strains alone required more than one growing cycle to significantly reduce SCN egg hatching and population density.

Conclusion: This study revealed how soybean monoculture for decades induced microbiota homeostasis, leading to the formation of SCN-suppressive soil. The high relative abundance of antagonistic bacteria in the cyst suppressed the SCN population both directly and indirectly. Because uncontrolled proliferation will likely lead to quick demise due to host population collapse, obligate parasites like SCN may have evolved to modulate virulence/proliferation to balance these conflicting needs. Video Abstract.

Keywords: Heterodera glycines; Chitinase; Cyst microbiota; Induced resistance; Nematode suppression; Soybean; Suppressive soil.


Conflict of interest statement

The authors declare no competing interests.

Figures

Fig. 1
Fig. 1
The infection cycle of soybean cyst nematode (SCN), SCN suppressiveness of the field soils used in this study, and how various soil treatments affected SCN suppressiveness. A SCN eggs in the cyst hatch to release infective second-stage juvenile (J2) when a host is available. The J2 migrate towards soybean roots, penetrate to reach the vascular cylinder, and stimulate cylinder cells to form the syncytium (S), a feeding site that supports J2 differentiation into an adult nematode. Lemon-shaped adult female protrudes through the root surface and becomes the cyst when the female dies. Mature cysts typically fall off into the surrounding soil and remain dormant until stimulated by root exudates. ED, PC, PM and XM denote endodermis, pericycle, phloem, and xylem, respectively. B Egg densities were measured after growing soybean plants for 56 days in field-treated soils inoculated with 1500 eggs per 100 g of dry soil. Different letters denote statistically significant differences according to the LSD test (p < 0.05). Suppressive (S) and conducive (C) soils collected from two provinces, transplantation soil (CS; created by mixing 10% S soil with 90% C soil), heat (80 °C)-treated S soil (S80), and S soil fumigated with formalin (SF) were used. C Identification of the likely sources of microbiota-suppressing SCN. Treatments of C, S and CS identical to those shown in B were included as references. The cyst and soybean rhizosphere treatments were conducted by replacing 10% S in the CS treatment with the following preparations derived from S soils: native cysts isolated from S field soils (C1-F), newly-formed cysts developed on soybean in S soils under greenhouse condition (C2-G) and suspension prepared from C2-G cysts (C3-G). For soybean rhizosphere, soybean seedling grown in S soil for 2 weeks and transplanted in C soil (Sb-G), rhizosphere soil prepared from soybean seedlings grown in S soils and then transfer to C soils (R1-G), and suspension prepared from of soybean rhizosphere and root in S soils and transferred to C soils (R2-G). D and E The number of J2s hatched after 100 cysts harvested from various soils were placed for 2 weeks in water. A solution of 0.05% ZnCl2 was used to stimulate egg hatching. The native cysts used were extracted from the field S and C soils. Fresh cysts referred to the cysts collected after growing soybean for 56 days in autoclaved soil. Newly formed cysts referred to the cysts collected after growing soybean in the soils of S, C, and CS treatments
Fig. 2
Fig. 2
Analyses of cyst-associated bacterial communities to identify candidate taxa for SCN suppressiveness. A Within-sample diversity (α-diversity) of bacteria associated with the cysts formed in the S, C, and CS soils and the S soil treated with heat (S80) or formalin (SF). The horizontal bar within each box indicates median value. The top and bottom of boxes denote the 75th and 25.th percentiles, respectively. Upper and lower whiskers extend 1.5 × the interquartile range from the upper and lower edges, respectively. All outliers are plotted as individual points. Different letters indicate statistically significant differences according to the LSD test (p < 0.05). B Numbers of unique and shared OTUs associated with cyst samples collected from the C, S and CS soils. C Linear regression relationship between cyst bacterial diversity and egg density (eggs/100 g of dry soil). The regression line is denoted by brown, and the shaded region indicates the confidence interval (geom_smooth function, method = lm). D Cluster analysis based on Bray–Curtis dissimilarity indicates the clear separation of bacterial communities inhabiting the cysts formed in the S and CS soils from those formed in the C, S80, and SF soils. OTUs with RA > 1‰ in at least one sample were included in the analysis. E Average RA of the most dominant taxa in the cysts formed in the S, C, CS, S80, and SF soils. Only taxa with RA > 1‰ in at least one sample were included in the analysis. Different letters above the bars indicate significant differences at the P < 0.05 level, according to the LSD test. F Linear regression relationship between four bacterial phyla associated with cysts and the egg density in the soil. The regression line is denoted by brown, and the shaded region corresponds to the confidence interval (geom_smooth function, method = lm)
Fig. 3
Fig. 3
Identification of candidate bacterial OTUs associated with SCN suppressiveness in two different locations. A Ternary plots show OTUs significantly enriched in the cysts formed in the S and CS soils compared to those formed in the C soils of BC and FL. The colour and size of the circle denote the samples in which individual OTUs are enriched and their relative abundance (RA), respectively. Golden (OTUs significantly enriched in those formed in S compared to C; S > C OTUs); Pink (OTUs significantly enriched in those formed in CS compared to C; CS > C OTUs); Green (OTUs enriched in those formed in both S and CS compared to C; S + CS > C OTUs); Grey (those that were not enriched in any samples). The position of each circle is determined by the contribution of the indicated compartments to the total RA. Only the OTUs with RA > 1‰ in at least one sample were included in the analysis. B Heatmaps showing RAs of the OTUs significantly enriched in the cysts formed in the S (golden circle), CS (pink circle) and both S and CS (green circle) soils. The OTUs highlighted were enriched in cysts formed in both the S and CS soils from Baicheng (BC) and Fulaerji (FL). C The RA of six OTUs enriched in cysts formed in S and CS compared to the other three treatments. Different letters above the bars indicate significant differences at the P < 0.05 level, according to the LSD test. D Linear regression relationship between the RA of Chitinophaga (OTU9 and OTU 18), Nocardiopsis (OTU20), Dyadobacter (OTU26), Ralstonia (OTU48), and Microbacterium (OTU55) and the egg density (eggs/100 g dry soil). The regression line is denoted by brown, and the shaded region represents the confidence interval (geom_smooth function, method = lm)
Fig. 4
Fig. 4
Analyses of how Chitinophaga and Dyadobacter isolates affect SCN individually and in combinations. A Cladogram showing the phylogenetic relationship among the cultured strains (identified using their 16S rRNA sequences). B Phylogenetic tree showing the relationship of OTU9, OTU18 and OTU26 with previously characterized Chitinophaga and Dyadobacter spp. Black and green denote those retrieved from GenBank and the isolates from this study, respectively. Two OTUs corresponding to Chitinophaga and one OTU corresponding to Dyadobacter (red) were included in this analysis. C The effect of Chitinophaga (C7, C18, C42, C54, CN, C1, C3) and Dyadobacter (D18, D18C, D27) isolates on the viability of SCN J2s (percentage of living J2s after coincubation). D The number of J2s hatched from 100 cysts 7 days after incubation with each isolate. Water was used as the control (CK). E The numbers of Chitinophaga (C54 and CN7) and Dyadobacter (D18C) cells per SCN female and cyst were quantified. The females and cysts collected after 8 weeks of soybean growth in autoclaved C soil infested with SCN eggs were used. F Egg densities were measured 56 days after growing soybean plants in the C soil amended with SCN eggs (1500/100 g of dry soil) and C54, CN7, D18C, C54-CN7, C54-D18C, CN7-D18C, and C54-CN7-D18C. Two independent assays were performed. The total number of inoculated bacterial cells was 107 CFU/g of dry soil, regardless the number of isolates used. G After measuring egg densities as described in (F), two more cycles of soybean plant growth for 56 days in the same soils were performed without adding new bacterial cells. Egg density was measured after each cycle. Error bar denotes the standard error of the mean. Different letters indicate statistically significant differences between treatments as determined by one-way ANOVA with the LSD test (P < 0.05). H Colony morphology of Chitinophaga (C54 and CN7) and Dyadobacter (D18C) isolates on R2A medium. I Microscopic observation of eggs carrying J1 after incubating the cysts with Chitinophaga (C54 and CN7) and Dyadobacter (D18C) in autoclaved C soil. Water served as the control (CK). J Chitinase activity of Chitinophaga isolates C54 and CN7 in the presence of SCN eggs. K J2 with attached Dyadobacter isolate D18C. Scale bar = 5 µm. L Heatmap showing relative expression levels of selected soybean defence-related genes involved in the salicylic acid, jasmonic acid and ethylene signalling pathway. GmSAMT, salicylic acid methyltransferase; GmPR1, pathogenesis related-1; GmNPR1, non-expresser of pathogenesis related-1 gene; GmACS9b, 1-Aminocyclopropane-1-carboxylic acid synthase; GmCHIA1, chitinase class I; GmPR10, pathogenesis related-10; GmPAD4, phytoalexin deficient 4; GmPAL, phenylalanine ammonia lyase; GmWRKY31. The data were normalized using the reference gene GmActin
Fig. 5
Fig. 5
Conceptual model illustrating the mechanism of SCN suppression in suppressive soils. Two cyst-associated bacteria employ distinct mechanisms to suppress SCN. (1) Enrichment of Chitinophaga in cysts causes malformation of first-stage juveniles presumably due to their chitinases, significantly reducing viable J2s. (2) Enrichment of Dyadobacter in cysts leads to its attachment to the surface coat of hatching J2s, and such J2s induce resistance in soybean by increasing defence-related gene expression, thereby reducing plant infection

References

    1. Liu XB, Herbert SJ. Fifteen years of research examining cultivation of continuous soybean in northeast China: a review. Field Crops Res. 2002;79:1–7. doi: 10.1016/S0378-4290(02)00042-4. - DOI
    1. Raaijmakers JM, Mazzola M. Soil immune responses. Science. 2016;352:1392–1393. doi: 10.1126/science.aaf3252. - DOI - PubMed
    1. Mendes R, Kruijt M, De Bruijn I, et al. Deciphering the rhizosphere microbiome for disease-suppressive bacteria. Science. 2011;332:1097–1100. doi: 10.1126/science.1203980. - DOI - PubMed
    1. Berendsen RL, Vismans G, Yu K, et al. Disease-induced assemblage of a plant-beneficial bacterial consortium. ISME J. 2018;12:1496–1507. doi: 10.1038/s41396-018-0093-1. - DOI - PMC - PubMed
    1. Bakker PA, Pieterse CM, de Jonge R, et al. The soil-borne legacy. Cell. 2018;172:1178–1180. doi: 10.1016/j.cell.2018.02.024. - DOI - PubMed