

Quantitative Microbial Risk Assessment of Antibiotic-Resistant E. coli, Legionella pneumophila, and Mycobacteria in Nonpotable Wastewater Reuse Applications
- PMID: 39004818
- PMCID: PMC11270989
- DOI: 10.1021/acs.est.4c01690
Quantitative Microbial Risk Assessment of Antibiotic-Resistant E. coli, Legionella pneumophila, and Mycobacteria in Nonpotable Wastewater Reuse Applications
Abstract
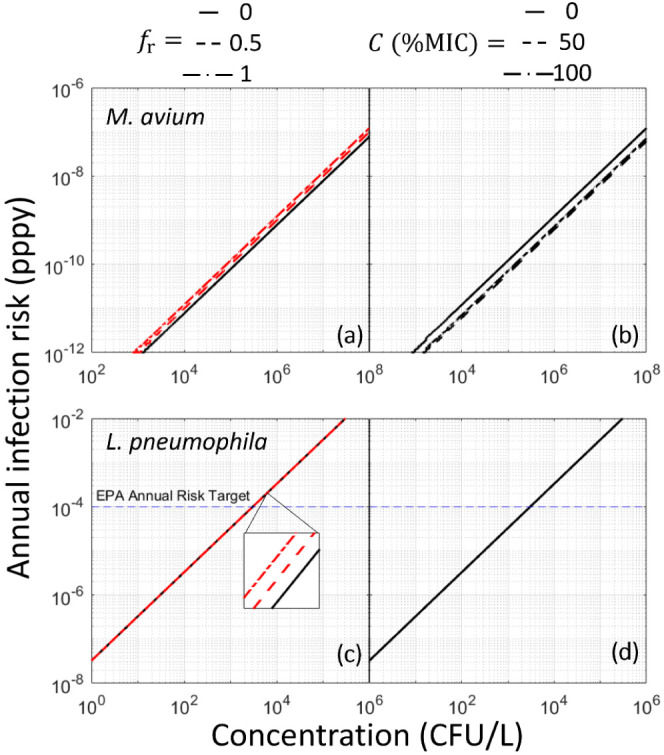
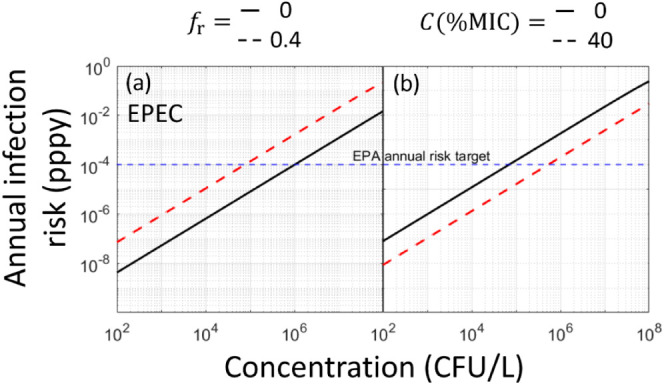
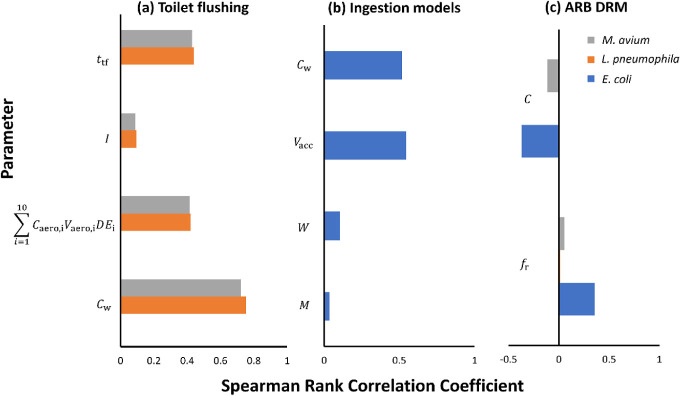
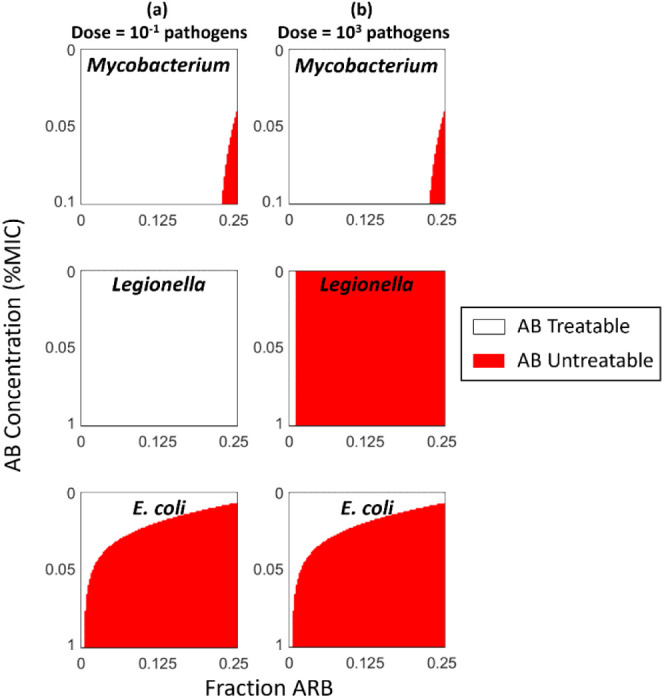
Antibiotic-resistant bacteria (ARB) have become a major threat to public health and modern medicine. A simple death kinetics-based dose-response model (SD-DRM) was incorporated into a quantitative microbial risk assessment (QMRA) to assess the risks of exposure to reclaimed wastewater harboring antibiotic-resistant E. coli, Legionella pneumophila, and Mycobacterium avium for multiple exposure scenarios. The fractions of ARB and trace antibiotics present in the body were incorporated to demonstrate their impact on infection risks. Both ARB and antibiotic susceptible bacteria, ASB, are assumed to have the same dose-response in the absence of antibiotics but behave differently in the presence of residual antibiotics in the body. Annual risk of L. pneumophila infection exceeded the EPA 10-4 pppy (per person per year) benchmark at concentrations in reclaimed water greater than 103-104 CFU/L, depending on parameter variation. Enteropathogenic E. coli infection risks meet the EPA annual benchmark at concentrations around 105-106 total E. coli. The results illustrated that an increase in residual antibiotics from 0 to 40% of the minimum inhibitory concentration (MIC) reduced the risk by about 1 order of magnitude for E. coli but was more likely to result in an untreatable infection.
Keywords: Monte Carlo simulation; dose−response; exposure assessment; simple death; sustainable water management.
Conflict of interest statement
The authors declare no competing financial interest.
Figures
Similar articles
-
Assessment of antibiotic-resistant infection risks associated with reclaimed wastewater irrigation in intensive tomato cultivation.Water Res. 2024 May 1;254:121437. doi: 10.1016/j.watres.2024.121437. Epub 2024 Mar 7. Water Res. 2024. PMID: 38479171
-
Protective masks reduced gastrointestinal risks of antibiotic-resistant E. coli for hospital wastewater treatment plant workers: A quantitative microbial risk assessment.Environ Pollut. 2025 Jun 1;374:126180. doi: 10.1016/j.envpol.2025.126180. Epub 2025 Apr 2. Environ Pollut. 2025. PMID: 40185188
-
Prevalence of antibiotic-resistant enterobacteriaceae in domestic wastewater and associated health risks in reuse practices.Int J Hyg Environ Health. 2025 Jan;263:114478. doi: 10.1016/j.ijheh.2024.114478. Epub 2024 Oct 5. Int J Hyg Environ Health. 2025. PMID: 39369488
-
Antibiotic resistant bacteria and genes in wastewater treatment plants: From occurrence to treatment strategies.Sci Total Environ. 2022 Sep 10;838(Pt 4):156544. doi: 10.1016/j.scitotenv.2022.156544. Epub 2022 Jun 6. Sci Total Environ. 2022. PMID: 35679932 Review.
-
What happens in hospitals does not stay in hospitals: antibiotic-resistant bacteria in hospital wastewater systems.J Hosp Infect. 2016 Aug;93(4):395-402. doi: 10.1016/j.jhin.2016.01.010. Epub 2016 Feb 1. J Hosp Infect. 2016. PMID: 26944903 Review.
Cited by
-
Combining Phenotypic and Genotypic Methods for the Rapid Detection of Antibiotic-Resistant Bacteria in Wastewater Using a Microfluidic Centrifugal Disc.ACS ES T Eng. 2025 May 8;5(8):1943-1952. doi: 10.1021/acsestengg.5c00107. eCollection 2025 Aug 8. ACS ES T Eng. 2025. PMID: 40809007 Free PMC article.
References
MeSH terms
Substances
LinkOut - more resources
Full Text Sources
Medical
Research Materials
