. 2024 Oct;150(14):1101-1120.
doi: 10.1161/CIRCULATIONAHA.124.069315. Epub 2024 Jul 15.

Novel Long Noncoding RNA HEAT4 Affects Monocyte Subtypes, Reducing Inflammation and Promoting Vascular Healing

Affiliations

Novel Long Noncoding RNA HEAT4 Affects Monocyte Subtypes, Reducing Inflammation and Promoting Vascular Healing

Jasmin M Kneuer et al. Circulation. 2024 Oct.

Abstract

Background: Activation of the immune system contributes to cardiovascular diseases. The role of human-specific long noncoding RNAs in cardioimmunology is poorly understood.

Methods: Single-cell sequencing in peripheral blood mononuclear cells revealed a novel human-specific long noncoding RNA called HEAT4 (heart failure-associated transcript 4). HEAT4 expression was assessed in several in vitro and ex vivo models of immune cell activation, as well as in the blood of patients with heart failure (HF), acute myocardial infarction, or cardiogenic shock. The transcriptional regulation of HEAT4 was verified through cytokine treatment and single-cell sequencing. Loss-of-function and gain-of-function studies and multiple RNA-protein interaction assays uncovered a mechanistic role of HEAT4 in the monocyte anti-inflammatory gene program. HEAT4 expression and function was characterized in a vascular injury model in NOD.CB17-Prkdc scid/Rj mice.

Results: HEAT4 expression was increased in the blood of patients with HF, acute myocardial infarction, or cardiogenic shock. HEAT4 levels distinguished patients with HF from people without HF and predicted all-cause mortality in a cohort of patients with HF over 7 years of follow-up. Monocytes, particularly anti-inflammatory CD16+ monocytes, which are increased in patients with HF, are the primary source of HEAT4 expression in the blood. HEAT4 is transcriptionally activated by treatment with anti-inflammatory interleukin-10. HEAT4 activates anti-inflammatory and inhibits proinflammatory gene expression. Increased HEAT4 levels result in a shift toward more CD16+ monocytes. HEAT4 binds to S100A9, causing a monocyte subtype switch, thereby reducing inflammation. As a result, HEAT4 improves endothelial barrier integrity during inflammation and promotes vascular healing after injury in mice.

Conclusions: These results characterize a novel endogenous anti-inflammatory pathway that involves the conversion of monocyte subtypes into anti-inflammatory CD16+ monocytes. The data identify a novel function for the class of long noncoding RNAs by preventing protein secretion and suggest long noncoding RNAs as potential targets for interventions in the field of cardioimmunology.

Keywords: RNA, long noncoding; heart failure; monocytes; regeneration.


Conflict of interest statement

None.

Figures
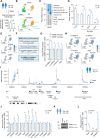
Figure 1.
Figure 1.
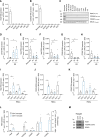
Characterization of peripheral immune cell populations altered in patients with heart failure and identification of altered HEAT4 expression. A, Schematic illustration of single-cell RNA sequencing. Peripheral blood mononuclear cells (PBMCs) are isolated from blood samples drawn from controls (n=3) and patients with heart failure (HF; n=8; cohort 1), then subjected to single-cell RNA sequencing. Sequenced cells are presented as mean per group (controls, n=3; HF, n=8; 2-tailed unpaired t test). B, Uniform manifold approximation and projection (UMAP) plots showing the final annotation of single cell clusters to immune cell types in PBMCs from controls and patients with HF. A total of 20 000 randomly selected cells per condition are shown for comparability. C, Percentages of the annotated cell types are shown as mean for each group. D, The percentage of T cells, all monocytes, and the monocyte subtypes CD16 and CD16+ in controls and patients with HF, shown as mean per group (controls, n=3; HF, n=8; 2-tailed unpaired t tests with Welch correction). E, Cell type–specific expression of CD14, FCGR3A (CD16), and CEBPB according to (B). F, Single-cell RNA sequencing data obtained from PBMCs from controls and patients with HF are analyzed for the expression of 56 846 long noncoding RNAs (lncRNAs) included in the LNCipedia database. The analysis identified 137 lncRNAs that are specifically expressed in monocytes, among which lnc-CEBPB-13, lnc-GHRH-4, lnc-KLF6-20, and HEAT4 (heart failure–associated transcript 4) are the top upregulated lncRNAs in CEBPB+ vs CEBPB monocytes. G, Relative expressions of lnc-CEBPB-13, lnc-GHRH-4, lnc-KLF6-20, and HEAT4 in CEBPB+ vs CEBPB monocytes based on the single-cell RNA sequencing data (CEBPB, n=12 224; CEBPB+, n=22 932; 2-tailed Mann-Whitney tests). H, Cell type–specific expression of genes shown in F and G according to B in PBMCs from all samples together (controls+patients with HF; n=11). I, Mean read coverage of genes located on chromosome 17 between base pairs 72460000 and 72711000 (hg19) detected by next-generation bulk RNA sequencing in PBMCs from controls (n=4) and patients with HF (n=4; cohort 2) shown as track plot. Locations of the genes on the forward (arrow pointing right; →) or reverse strand (arrow pointing left; ←) and the idiogram of chromosome 17 are shown below. J, RNA expression of the genes located on chromosome 17 base pairs 72460000 to 72711000 in patients with HF (n=4) relative to controls (n=4; 2-tailed unpaired t tests). K, Agarose gels showing the levels of HEAT4 and RPLP0, which was used as a reference gene, in 2 representative patients from cohort 3. Thirty quantitative polymerase chain reaction cycles were used for HEAT4 and 29 for RPLP0. L, RNA levels of HEAT3 (heart failure–associated transcript 3), HEAT4, and CD300LB determined by quantitative real-time polymerase chain reaction in whole blood samples from the sex-mixed validation cohort (cohort 3) of controls (n=38) and patients with HF (n=63; 2-tailed Mann-Whitney tests). Bar graphs are presented as mean+SEM. Statistical differences were calculated using Mann-Whitney test or unpaired t test with or without Welch correction (*P<0.05). Figures 1A, 1I, and 1K were drawn in part using images from Servier Medical Art. Servier Medical Art by Servier is licensed under a Creative Commons Attribution 3.0 Unported License (https://creativecommons.org/licenses/by/3.0/).
Figure 2.
Figure 2.
Association of HEAT3, HEAT4, CD300LB, and CD300LD with incidence and survival in heart failure. A, Area under the receiver operating characteristic (AUC) curve for HEAT3 (heart failure–associated transcript 3), HEAT4 (heart failure–associated transcript 4), CD300LB, and CD300LD level using a univariate model demonstrating the discriminatory ability of each RNA between controls (n=38) and patients with heart failure (HF; n=63, cohort 3). B, The relationship between survival time and HEAT3, HEAT4, CD300LB, and CD300LD level as continuous predictor variables using a Cox proportional hazards analysis (univariate model) indicates the all-cause mortality risk as hazard ratio (HR). Participants (cohort 3) were followed for >7 years (mean follow-up time, 2701±998 days) until the database was censored. Kaplan-Meier curves visualize the probability of survival into 2 groups of patients with HF with lower or higher RNA expression of HEAT3 (median, 0.0025; C), HEAT4 (median, 0.0169; D), CD300LB (median, 0.0506; E) and CD300LD (median, 0.0185; F), each divided by their median. Comparisons of the 2 survival curves were assessed by Mantel-Cox log-rank test.
Figure 3.
Figure 3.
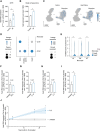
Differential expression of HEAT4 and other CD300 gene cluster members in monocyte subpopulations and their cellular origins. RNA expression of HEAT4 (heart failure–associated transcript 4; A) and CD300LB (B) in human primary monocytes, the human monocytic cell line THP1, human umbilical vein endothelial cells (HUVEC), human coronary artery endothelial cells (HCAEC), smooth muscle cells (SMC), human embryonic kidney cells (HEK), and human cardiac myocytes (HCM) measured by quantitative real-time polymerase chain reaction (qRT-PCR; n=2–4). C, RNA expression of HEAT4, CD300LB, CD300C, and RPLP0 in human blood derivatives (primary monocytes and whole blood) and tissues (left ventricle, left atrium, skeletal muscle, stomach, artery, brain, lung, liver, and kidney) visualized by agarose gel electrophoresis after qRT-PCR. A total of 28 PCR cycles were used for HEAT4, CD300LB, and CD300C and 30 for RPLP0. RNA expression of CD163 (n=4; repeated-measures [RM] 1-way ANOVA followed by Dunnett multiple comparisons test (D), HEAT4 (n=7 or 8; mixed-model ANOVA followed by Dunnett multiple comparisons test; E), HEAT3 (heart failure–associated transcript 3; n=6; Friedman test followed by Dunn multiple comparison test; F), CD300LB (n=8; RM 1-way ANOVA followed by Dunnett multiple comparisons test; G), and CD300C (n=7; RM 1-way ANOVA followed by Dunnett multiple comparisons test; H) in human primary monocytes and in M1 and M2 macrophages (ΜΦ) differentiated from monocytes using GM-CSF and M-CSF, respectively, measured by qRT-PCR. RNA expression of HEAT4 (n=4–7; 2-tailed paired t tests; I), CD300LB (n=4–7; 2-tailed paired t tests; J), and CD300C (n=4; 2-tailed paired t tests; K) in human PBMCs separated into CD14 positive and negative, CD16 positive and negative, or Pan T positive and negative cells by magnetic activated cell sorting measured by qRT-PCR. L, RNA expression of HEAT4, HEAT3, CD300LB, CD300C, MALAT1, and FCGR3A (CD16) in human primary monocytes separated into CD16 positive and negative monocytes by magnetic activated cell sorting after isolation by counterflow centrifugal elutriation measured by qRT-PCR (n=4–5; 2-tailed paired t tests). M, Agarose gels showing the levels of HEAT4, FCGR3A (CD16), and RPLP0 in representative fractions of CD16 positive and negative monocytes. Bar graphs are presented as mean+SEM. Statistical differences were calculated using paired t test or repeated measures or mixed-model 1-way ANOVA, both followed by Dunnett multiple comparisons test or Friedman test followed by Dunn multiple comparison test (*P<0.05).
Figure 4.
Figure 4.
Regulation of HEAT4 expression. Bar graphs showing RNA expression of HEAT4 (heart failure–associated transcript 4) in peripheral blood mononuclear cells (PBMCs) of controls (n=3) and patients with heart failure (HF; n=8, cohort 1) measured by quantitative real-time polymerase chain reaction (qPCR; 2-tailed unpaired t test; A) and single-cell RNA sequencing (controls, n=24 573; HF, n=59 016; 2-tailed Mann-Whitney test; B). C, Feature plots showing HEAT4 expression in 20 000 randomly selected cells of all individuals per condition. D, Dot plots show percentage of cells expressing CD14, FCGR3A (CD16), and HEAT4 as well as their average expression level in monocyte subtypes (CD16 and CD16+) of all samples together (controls+patients with HF; n=11). Left legend accounts for CD14 and FCGR3A (CD16) expression and right legend for HEAT4 expression in CD16 and CD16+ monocytes, respectively. E, Violin plots comparing the expression of FCGR3A (CD16) in HEAT4 positive and negative monocytes from controls (n=3; 2-tailed Mann-Whitney test), patients with HF (n=8; 2-tailed Mann-Whitney test), and all samples together (controls+patients with HF, n=11; 2-tailed Mann-Whitney test). RNA expression of HEAT4 in human primary monocytes after treatment with tumor necrosis factor α (TNFα; 10 ng/mL; F), interleukin (IL)–1β (10 ng/mL; G), IL-6 (10 ng/mL; H), or IL-10 (100 ng/mL; I) for 24 hours relative to untreated (n=5; 2-tailed paired t tests). J, RNA expression of HEAT4 in human primary monocytes after stimulation with IL-10 (100 ng/mL) for 1, 3, 17, and 24 hours (n=4; 2-tailed paired t tests). Bar graphs are presented as mean+SEM or mean±SEM (J, colored area). Statistical differences were calculated using paired and unpaired t test or Mann-Whitney test (*P<0.05). UMAP indicates uniform manifold approximation and projection. Figure 4E was drawn in part using images from Servier Medical Art. Servier Medical Art by Servier is licensed under a Creative Commons Attribution 3.0 Unported License (https://creativecommons.org/licenses/by/3.0/).
Figure 5.
Figure 5.
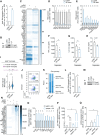
Overexpression of the lncRNA HEAT4 in human monocytes induces anti-inflammatory and vascular healing functions and promotes CD16+ monocyte populations. Overexpression (OE) of HEAT4 (heart failure–associated transcript 4) on RNA level measured by quantitative real-time polymerase chain reaction (qRT-PCR; n=5; 2-tailed Wilcoxon matched-pairs signed rank test; A) and agarose gel electrophoresis (B). C, Heat map showing selection of the top upregulated and downregulated genes after HEAT4 overexpression identified by next-generation bulk RNA sequencing (n=4). Validation of downregulated (n=4–6; 2-tailed paired t test; D) and upregulated (n=4; 2-tailed paired t test; E) genes in monocytes with HEAT4 OE by qRT-PCR. Protein levels of tumor necrosis factor α (TNFα; n=4; 2-tailed paired t test; F), interleukin (IL)–1β (n=4; 2-tailed paired t test; G), and IL-6 (n=4; 2-tailed paired t test; H) in supernatants of human primary monocytes without and with HEAT4 OE measured by ELISA. I, Single-cell RNA sequencing of human primary monocytes without or with HEAT4 OE was performed. Monocytes in both conditions were divided into HEAT4+ and HEAT4 monocytes on the basis of the HEAT4 expression of each individual cell. Percentage of CD16+ monocytes among the HEAT4+ monocytes is given in the upper panel; the left pie chart shows control condition (pcDNA) and right pie chart shows OE HEAT4. HEAT4 expression level of HEAT4+ monocytes for both conditions is given in the bottom panel (pcDNA, n=28; OE HEAT4, n=152; 2-tailed Mann-Whitney test). J, Representative flow cytometric measurements of human primary monocytes without or with HEAT4 overexpression labelled with antibodies targeting CD14 and CD16. K, Stacked bar plots showing percentages of the 3 monocyte subtypes (CD14++, CD16), (CD14++, CD16+), and (CD14+, CD16++) among human primary monocytes without or with HEAT4 overexpression on the basis of flow cytometry analysis (n=5; 2-tailed paired t test). Knockdown of HEAT4 was validated on RNA level by qRT-PCR (n=5; 2-tailed paired t test; L) and agarose gel electrophoresis (M). N, Heat map showing genes with altered expressions in monocytes without and with HEAT4 knockdown and in the presence and absence of lipopolysaccharides (100 ng/mL, 6 hours) analyzed by next-generation bulk RNA sequencing (n=4). O, Top upregulated genes in monocytes with HEAT4 knockdown and lipopolysaccharides (100 ng/mL, 6 hours) treatment (FPKM, n=4; 2-tailed paired t tests). RNA expression of IL1β (n=5; ordinary 2-way ANOVA followed by Tukey multiple comparisons test; P) and IL6 (n=7; ordinary 2-way ANOVA followed by Tukey multiple comparisons test; Q) in human primary monocytes after HEAT4 knockdown and lipopolysaccharides (100 ng/mL, 6 hours) or TNFα (10 ng/mL, 6 hours) treatment measured by qRT-PCR. Bar graphs are presented as mean+SEM. Statistical differences were calculated using paired and unpaired t test or Wilcoxon matched-pairs signed rank test or Mann-Whitney test or ordinary 2-way ANOVA followed by Tukey multiple comparisons test (*P<0.05).
Figure 6.
Figure 6.
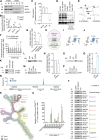
Interaction of the lncRNA HEAT4 with S100A9 in the cytoplasm of human monocytes. A, Representative image and quantification (B) of HEAT4 (heart failure–associated transcript 4), RPLP0 (poly[A] positive control), and circRELL1 (poly[A] negative control) RNAs in poly(A) positive and negative RNA fractions of human primary monocytes separated by oligo d(T)25 magnetic beads and analyzed by agarose gel electrophoresis (n=3; 1-tailed [positive controls: poly(A) positive: RPLP0; poly(A) negative: circRELL1] and 2-tailed [HEAT4] paired t tests). C, Localizations of HEAT4, RPLP0 (cytoplasmic control), and U6 (nuclear control) RNAs in nuclear and cytoplasmic fractions of human primary monocytes analyzed by quantitative real-time polymerase chain reaction (qRT-PCR). D, In vitro translations of HEAT4 and DHFR (positive control) without and with Ni-NTA purification analyzed by SDS-PAGE using a 4% to 20% gel followed by Coomassie staining. Asterisks indicate the translated DHFR (dihydrofolate reductase) protein. E, Schematic illustration of the RNA accessibility assay to identify probe-accessible sites on the HEAT4 RNA. RNase H (blue) can recognize and cleave the RNA in antisense DNA oligonucleotide (red)–RNA (gray) heteroduplexes. Inaccessible sites (green and purple; eg, due to binding of proteins) are not cleaved and result in similar HEAT4 RNA expression as when no antisense DNA oligonucleotide was added. F, Accessible regions of the HEAT4 RNA indicated by reduced HEAT4 expression signal using monocyte lysates treated with or without an antisense DNA oligonucleotide (AS DNA oligo) followed by RNase H digestion and analyzed by qRT-PCR (n=3–5; 1-tailed paired t test and Wilcoxon matched-pairs signed rank test). G, HEAT4 enrichment after RNA affinity purification using against-HEAT4 directed 2′O-Me-RNA oligonucleotides (sequence of AS oligo 6) in lysates of human primary monocyte analyzed by qRT-PCR (n=3 per elution; 2-tailed Wilcoxon matched-pairs signed rank test). H, Venn diagram showing overlaps between proteins bound to HEAT4 isolated by HEAT4 RNA affinity purification and identified by mass spectrometry with genes enriched in monocytes detected by single-cell RNA sequencing. Feature plots showing S100A8 (I) and S100A9 (J) expression in 20 000 peripheral blood mononuclear cells of controls of cohort 1 (n=3). K, RNA affinity purification of HEAT4 using 2′O-Me-RNA oligonucleotides with subsequent immunoblotting for S100A8 and S100A9. RNA immunoprecipitation (RIP) of S100A8 in human primary monocytes after HEAT4 overexpression (OE) with subsequent immunoblotting for S100A8 (L) and detection of HEAT4 (M) by agarose gel electrophoresis after qRT-PCR. N, Quantitation of HEAT4 bound to S100A8 isolated by RIP and analyzed by qRT-PCR (n=4; 1-tailed paired t test). RIP of S100A9 in human primary monocytes after HEAT4 OE with subsequent immunoblotting for S100A9 (O) and detection of HEAT4 (P) by agarose gel electrophoresis after qRT-PCR. Q, Quantitation of HEAT4 bound to S100A9 isolated by RIP and analyzed by qRT-PCR (n=3; 1-tailed paired t test). R, Reads per bin of CD300LB, HEAT4, and CD300C (all hg19) detected by next-generation bulk RNA sequencing in monocytes after RIP using immunoglobulin G (IgG) or S100A9 antibody. All genes are located on the reverse strand (arrow pointing left, ←). S, Schematic illustration of the distribution of the 10 HEAT4 deletion constructs Δ1 to Δ10 on HEAT4 folded according to the prediction of RNAfold WebServer. Exons 1 and 2 of HEAT4 are distinguished on the basis of their color. T, Agarose gels showing the levels of HEAT4, RPLP0, and the HEAT4 deletion constructs Δ1 through Δ10 in human embryonic kidney (HEK) cells after cotransfection of S100A9-Flag and the respective deletion construct or HEAT4–full length. U, RNA expression of HEAT4–full length and HEAT4 deletion constructs Δ1 through Δ10 in HEK cells after cotransfection of S100A9-Flag and HEAT4–full length or HEAT4 deletion constructs Δ1 through Δ10 and subsequent Flag-IP compared with Flag-IP of pcDNA-transfected HEK cells (n=2–5). Bar graphs show mean+SEM. Statistical differences were calculated using paired and unpaired t test or Wilcoxon matched-pairs signed rank test or Mann-Whitney test (*P<0.05). UMAP indicates uniform manifold approximation and projection. Figure 6E was drawn in part using images from Servier Medical Art. Servier Medical Art by Servier is licensed under a Creative Commons Attribution 3.0 Unported License (https://creativecommons.org/licenses/by/3.0/).
Figure 7.
Figure 7.
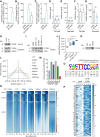
HEAT4 reduces extracellular S100A8/A9 levels and leads to nuclear translocation of S100A9. A, RNA level of S100A9 in monocytes without or with S100A9 overexpression (OE; n=7; 2-tailed Wilcoxon matched-pairs signed rank test). B, Interleukin (IL) 6 RNA expression in monocytes without or with S100A9 OE alone or with co-overexpression of HEAT4 (heart failure–associated transcript 4) measured by quantitative real-time polymerase chain reaction (n=5; 1-tailed Wilcoxon matched-pairs signed rank test). C, HEAT4 RNA expression in monocytes without or with S100A9 OE (n=6; 2-tailed Wilcoxon matched-pairs signed rank test). S100A9 protein levels in cell lysates (n=4; 2-tailed paired t test; D) and supernatants (n=4; 2-tailed Wilcoxon matched-pairs signed rank test; E) of monocytes without or with HEAT4 overexpression measured by ELISA. S100A8/A9 heterodimer protein levels in cell lysates (n=4; 2-tailed paired t test; F) and supernatants (n=3; 2-tailed paired t test; G) of monocytes without or with HEAT4 overexpression measured by ELISA. H, Nuclear and cytoplasmic S100A9 levels after treatment of human primary monocytes with IL-10 (100 ng/mL, 24 hours; control: pcDNA) identified by nucleus-cytoplasm fractionation followed by immunoblotting for S100A9 and GAPDH (cytoplasmic marker). Cytoplasmic samples were diluted 1:20 before loading. I, Nuclear S100A9 levels after HEAT4 OE and IL-10 treatment (100 ng/mL, 24 hours) identified by nucleus-cytoplasm fractionation followed by immunoblotting for S100A9. Exemplary blot showing HP1β (nucleus marker). Densitometric analysis of S100A9 (I, top) is shown (n=4; ordinary 2-way ANOVA followed by Tukey multiple comparisons test; J). K, Chromatin immunoprecipitation (ChIP) of S100A9 with subsequent immunoblotting for S100A9. L, Average profile of S100A9 (n=4) and histone modification ChIP peaks (obtained from USCS) binding to transcription start site (TSS) region. M, Percentage of peak overlap of S100A9 ChIP (n=4) and histone modification peaks. N, Heat map of S100A9 (n=4) and chromatin occupancy of the indicated factors at ±3000 bp of TSS. O, Top de novo DNA motif identified after S100A9 ChIP (n=4). P, Heat map of differential peaks (found in each of the 8 samples) enriched in S100A9 ChIP after IL-10 treatment and HEAT4 OE compared with S100A9 ChIP without treatment. Selected genes are shown that were increased after HEAT4 OE (Figure 5C). Statistical differences were calculated using paired t test or Wilcoxon matched-pairs signed rank test or ordinary 2-way ANOVA followed by Tukey multiple comparisons test (*P<0.05).
Figure 8.
Figure 8.
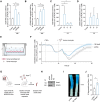
HEAT4 overexpression in monocytes enhances the endothelial barrier regeneration and promotes vascular healing. A, RNA levels of HEAT4 (heart failure–associated transcript 4) determined by quantitative real-time polymerase chain reaction (qRT-PCR) in peripheral blood mononuclear cells (PBMCs) from patients with acute myocardial infarction (AMI) separated into STEMI (n=21) and NSTEMI (n=21) relative to controls (n=23; cohort 4; Kruskal-Wallis followed by Benjamini-Krieger-Yekutieli test). B, RNA levels of CD300LB determined by qRT-PCR in PBMCs of patients with AMI separated into STEMI (n=19) and NSTEMI (n=21) relative to controls (n=23; cohort 4; Kruskal-Wallis followed by Benjamini-Krieger-Yekutieli test). C, RNA levels of HEAT4 determined by qRT-PCR in whole blood of patients with cardiogenic shock (CS; n=4) relative to controls (n=5; cohort 5; Kruskal-Wallis followed by Benjamini-Krieger-Yekutieli test). d0 represents day of revascularization; d1, 1 day after revascularization; and d2, 2 days after revascularization. D, RNA levels of CD300LB determined by qRT-PCR in whole blood of patients with CS (n=4) relative to controls (n=4; cohort 5; Kruskal-Wallis followed by Benjamini-Krieger-Yekutieli test). d0 represents day of revascularization; d1, 1 day after revascularization; and d2, 2 days after revascularization. E, Schematic illustration of the experimental setup for measuring the endothelial barrier function. F, The endothelial barrier function of human endothelial cells treated with 10 ng/mL tumor necrosis factor α (TNFα) followed by incubation with human primary monocytes without or with HEAT4 overexpression (OE; n=3; 2-tailed paired t tests). Test time points were selected a priori, covering maximal EC permeability and recovering phase after TNFα treatment. G, Schematic illustration of the experimental setup of a carotid artery injury model using nonobese diabetic–severe combined immunodeficiency (NOD-SCID) mice injected with human primary monocytes. The left carotid artery was excised after 3 days and examined. H, Expression of HEAT4 in human monocytes without or with HEAT4 OE used in the carotid artery injury model detected using agarose gel electrophoresis. Light microscopy image (I) and quantification (J) of reendothelialized areas at day 3 after carotid injury in NOD-SCID mice in HEAT4 OE (n=6) and control (n=6; 2-tailed unpaired t test) groups. Graphs are presented as mean+SEM. Statistical differences were calculated using paired and unpaired t test or Kruskal-Wallis followed by Benjamini-Krieger-Yekutieli test (*P<0.05). Figures 8E, 8F, and 8G were drawn in part using images from Servier Medical Art. Servier Medical Art by Servier is licensed under a Creative Commons Attribution 3.0 Unported License (https://creativecommons.org/licenses/by/3.0/).

References

    1. Greten FR, Eckmann L, Greten TF, Park JM, Li Z-W, Egan LJ, Kagnoff MF, Karin M. IKKβ links inflammation and tumorigenesis in a mouse model of colitis-associated cancer. Cell. 2004;118:285–296. doi: 10.1016/j.cell.2004.07.013 - PubMed
    1. Pikarsky E, Porat RM, Stein I, Abramovitch R, Amit S, Kasem S, Gutkovich-Pyest E, Urieli-Shoval S, Galun E, Ben-Neriah Y. NF-κB functions as a tumour promoter in inflammation-associated cancer. Nature. 2004;431:461–466. doi: 10.1038/nature02924 - PubMed
    1. McInnes IB, Schett G. Cytokines in the pathogenesis of rheumatoid arthritis. Nat Rev Immunol. 2007;7:429–442. doi: 10.1038/nri2094 - PubMed
    1. Huseby ES, Liggitt D, Brabb T, Schnabel B, Öhlén C, Goverman J. A pathogenic role for myelin-specific CD8+ T cells in a model for multiple sclerosis. J Exp Med. 2001;194:669–676. doi: 10.1084/jem.194.5.669 - PMC - PubMed
    1. Levine B, Kalman J, Mayer L, Fillit HM, Packer M. Elevated circulating levels of tumor necrosis factor in severe chronic heart failure. N Engl J Med. 1990;323:236–241. doi: 10.1056/NEJM199007263230405 - PubMed

MeSH terms

Substances