. 2024 Sep;11(35):e2404119.
doi: 10.1002/advs.202404119. Epub 2024 Jul 15.

An Ultrasensitive Biosensor for Probing Subcellular Distribution and Mitochondrial Transport of l-2-Hydroxyglutarate

Affiliations

An Ultrasensitive Biosensor for Probing Subcellular Distribution and Mitochondrial Transport of l-2-Hydroxyglutarate

Zhaoqi Kang et al. Adv Sci (Weinh). 2024 Sep.

Abstract

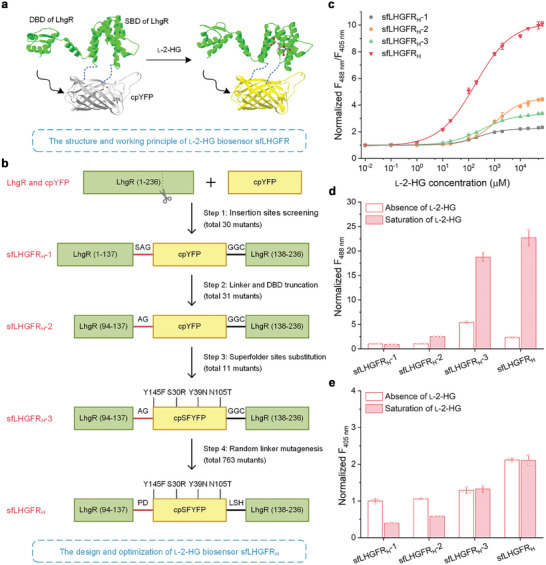
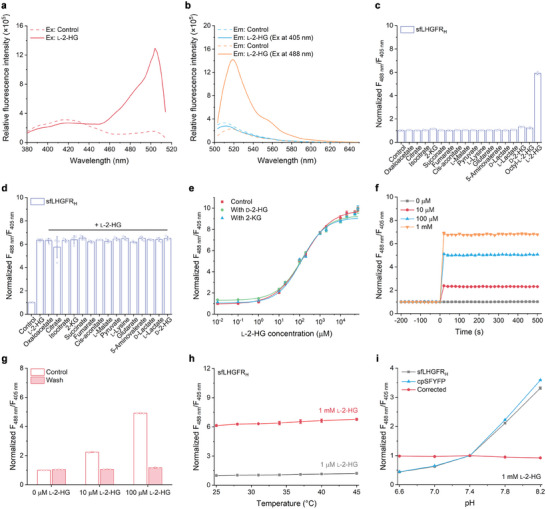
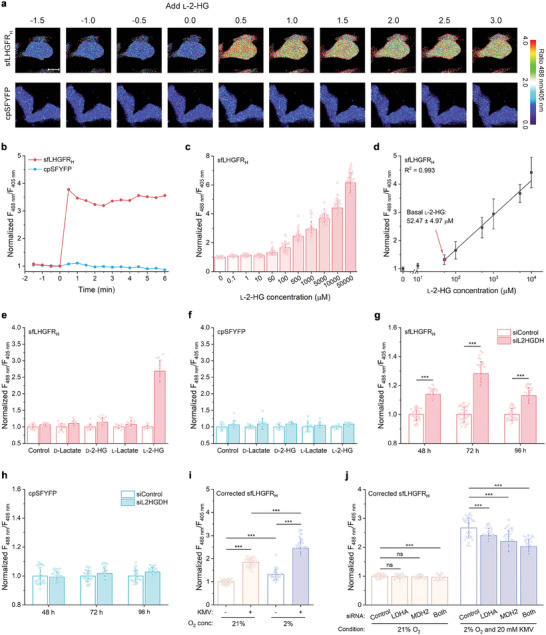
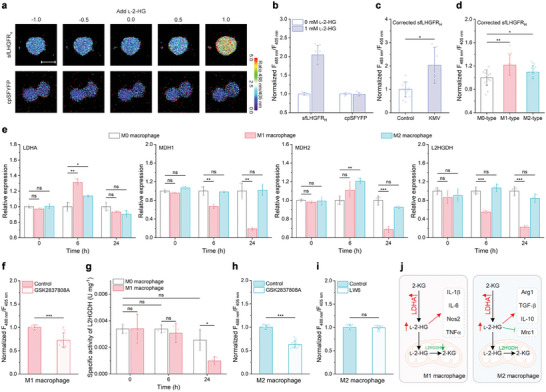
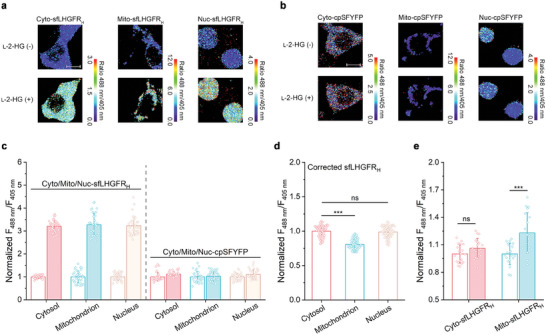
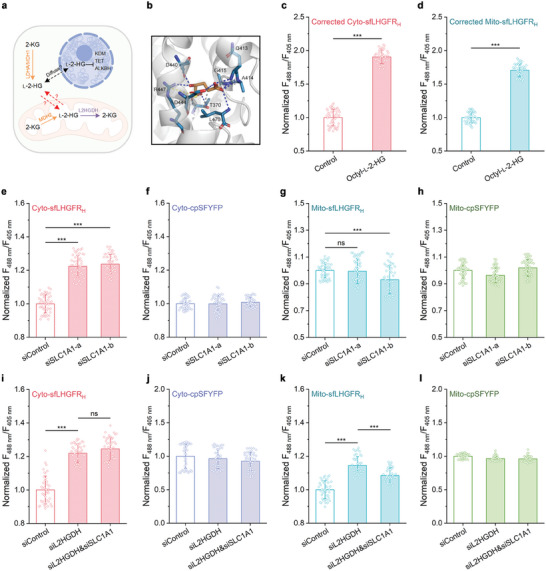
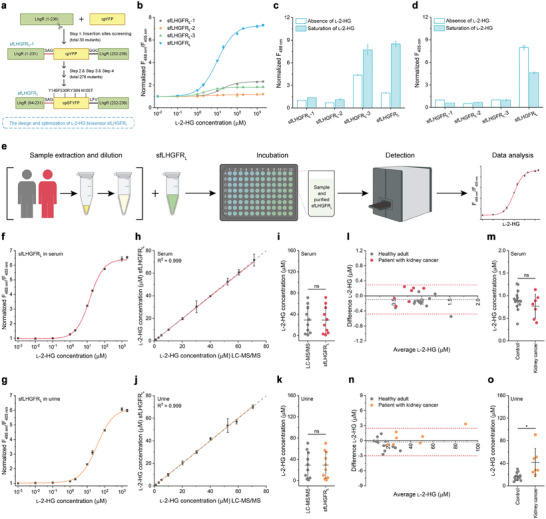
l-2-Hydroxyglutarate (l-2-HG) is a functionally compartmentalized metabolite involved in various physiological processes. However, its subcellular distribution and mitochondrial transport remain unclear owing to technical limitations. In the present study, an ultrasensitive l-2-HG biosensor, sfLHGFRH, composed of circularly permuted yellow fluorescent protein and l-2-HG-specific transcriptional regulator, is developed. The ability of sfLHGFRH to be used for analyzing l-2-HG metabolism is first determined in human embryonic kidney cells (HEK293FT) and macrophages. Then, the subcellular distribution of l-2-HG in HEK293FT cells and the lower abundance of mitochondrial l-2-HG are identified by the sfLHGFRH-supported spatiotemporal l-2-HG monitoring. Finally, the role of the l-glutamate transporter SLC1A1 in mitochondrial l-2-HG uptake is elucidated using sfLHGFRH. Based on the design of sfLHGFRH, another highly sensitive biosensor with a low limit of detection, sfLHGFRL, is developed for the point-of-care diagnosis of l-2-HG-related diseases. The accumulation of l-2-HG in the urine of patients with kidney cancer is determined using the sfLHGFRL biosensor.

Keywords: biosensor; l‐2‐hydroxyglutarate; metabolism; mitochondrial transport; point‐of‐care testing.


Conflict of interest statement

C.G., Z.K., C.M., and P.X. are inventors of patent applications (Chinese patent application no. 2023114979187). The patent was submitted by Shandong University. Other authors declare no relevant conflicts of interest.

Figures

Figure 1
Figure 1
Design of l‐2‐HG biosensor sfLHGFRH. a) Schematic representation of the working principle of sfLHGFR. DBD, DNA‐binding domain. SBD, substrate‐binding domain. b) Schematic representation of the development of sfLHGFRH. cpSFYFP, cpYFP with four superfolder sites. The numbering of the substituted amino acids in cpYFP corresponds to the sequence of the original YFP. c) Comparison of the dose‐response curves of sfLHGFRH‐1, sfLHGFRH‐2, sfLHGFRH‐3, and sfLHGFRH for l‐2‐HG. Data were normalized to the initial ratio. d,e) Comparison of the fluorescence intensities of sfLHGFRH‐1, sfLHGFRH‐2, sfLHGFRH‐3, and sfLHGFRH with excitation at 488 nm d) and 405 nm e). Data were normalized to the fluorescence intensity of sfLHGFRH‐1 in the absence of l‐2‐HG. All data shown are means ± standard deviations (s.d.) (n ≥ 3 independent experiments).
Figure 2
Figure 2
Characterization of sfLHGFRH. a) Fluorescence excitation spectra of sfLHGFRH with or without the addition of 1 mm l‐2‐HG. b) Fluorescence emission spectra of sfLHGFRH with or without the addition of 1 mm l‐2‐HG at 405 nm or 488 nm excitation. c) Specificity analysis of sfLHGFRH. The fluorescence ratios of sfLHGFRH were determined in the presence of 250 µm indicated metabolites. Data were normalized to the control. d) Influence of various metabolites on detection of l‐2‐HG by sfLHGFRH. The fluorescence ratios of sfLHGFRH were determined in the absence of any metabolite (control), in the presence of only l‐2‐HG (l‐2‐HG), and in the presence of l‐2‐HG and 250 µm indicated metabolites. Data were normalized to the control. e) Dose‐response curves of sfLHGFRH for increasing concentrations of l‐2‐HG in the presence of 250 µm d‐2‐HG or 2‐KG. Data were normalized to the initial ratio without d‐2‐HG and 2‐KG. f) Kinetics of the response of sfLHGFRH to l‐2‐HG. l‐2‐HG were added at time point zero. Data were normalized to the initial ratio without l‐2‐HG. g) Reversibility analysis of sfLHGFRH. The fluorescence ratios of sfLHGFRH after l‐2‐HG addition and subsequent removal were recorded. Data were normalized to the control with 0 µm l‐2‐HG. h) Temperature‐stability analysis of sfLHGFRH. Data were normalized to the initial ratio with 1 µm l‐2‐HG. i) pH‐correction of the fluorescence ratio of sfLHGFRH by cpSFYFP in the presence of 1 mm l‐2‐HG. Data were normalized to the ratio at pH 7.4. All data shown are means ± s.d. (n ≥ 3 independent experiments).
Figure 3
Figure 3
Visualization of l‐2‐HG metabolism in living cells using sfLHGFRH. a,b) Sequential images a) and quantitative data b) of sfLHGFRH and cpSFYFP expressed in HEK293FT cells in response to 5 mm l‐2‐HG addition. Scale bar, 10 µm. Data in panel b were normalized to the ratio at time point zero. c,d) Dose‐dependent response c) and calibration curve d) of sfLHGFRH for increasing concentrations of l‐2‐HG. Data were normalized to the initial ratio (n ≥ 13 cells). e,f) Specificity analysis of sfLHGFRH e) or cpSFYFP f) expressed in HEK293FT cells. The fluorescence ratios of sfLHGFRH and cpSFYFP before (blank column) and after (colored column) addition of the indicated metabolites were recorded. Data were normalized to the ratio before the addition of any metabolites (n = 13 cells). g,h) Identification of L2HGDH function using sfLHGFRH. The fluorescence ratios of sfLHGFRH g) and cpSFYFP h) were determined 48, 72, and 96 h after treatment with negative siRNA or siRNA targeting L2HGDH. Data were normalized to the control (n = 32 cells). i) Analysis of hypoxia‐induced l‐2‐HG production using sfLHGFRH. The fluorescence ratios of sfLHGFRH were determined 24 h after incubation of cells with 21% oxygen or 2% oxygen as well as in the absence or presence of 20 mm α‐keto‐β‐methylvaleric acid (KMV). Data were corrected by cpSFYFP and normalized to the normoxic condition without KMV (n ≥ 35 cells). j) Analysis of the anabolic mechanism of l‐2‐HG using sfLHGFRH. sfLHGFRH‐expressing HEK293FT cells were treated with different siRNAs for 24 h, and then cultured under the indicated conditions for another 24 h. Data were corrected by cpSFYFP and normalized to the normoxic condition treated with negative siRNA (n = 35 cells). All data shown are means ± s.d. *** p < 0.001; ns, no significant difference (p ≥ 0.05) in the two‐tailed t‐test.
Figure 4
Figure 4
Metabolism and function analysis of l‐2‐HG in macrophages using sfLHGFRH. a,b) Sequential images a) and quantitative data b) of sfLHGFRH or cpSFYFP in macrophages in response to 1 mm l‐2‐HG addition. Scale bar, 10 µm. Data in panel b were normalized to the ratio without l‐2‐HG (n = 7 cells). c) Response of sfLHGFRH to KMV‐mediated endogenous l‐2‐HG accumulation. Data were corrected by cpSFYFP and normalized to the control (n = 13 and 7 cells from left to right). d) Differences in l‐2‐HG concentrations between differently polarized macrophages measured by sfLHGFRH. Data were corrected by cpSFYFP and normalized to M0 macrophages (n ≥ 13 cells). e) qPCR analysis of the expression of key enzymes for l‐2‐HG metabolism in differently polarized macrophages. Data were analyzed 0, 6, and 24 h after inducer stimulation (n = 3 independent experiments). f) Identification of the function of LDHA in l‐2‐HG anabolism in M1 macrophages using sfLHGFRH. Data were corrected by cpSFYFP and normalized to control (n = 14 cells). g) Activities of L2HGDH in M0 and M1 macrophages. Data were detected 0, 6, and 24 h after inducer stimulation (n = 3 independent experiments). h,i) Identification of the functions of LDHA h) and MDH2 i) in l‐2‐HG anabolism in M2 macrophages using sfLHGFRH. Data were corrected by cpSFYFP and normalized to control (n = 13 cells). j) Schematic representation of the metabolic pathway and biological function of l‐2‐HG in M1 and M2 macrophages. All data shown are means ± s.d. * p < 0.05; ** p < 0.01; *** p < 0.001; ns, no significant difference (p ≥ 0.05) in the two‐tailed t‐test.
Figure 5
Figure 5
Analysis of subcellular distribution of l‐2‐HG using sfLHGFRH. a,b) Confocal microscopy imaging of a single HEK293FT cell expressing Cyo‐sfLHGFRH, Mito‐sfLHGFRH, Nuc‐sfLHGFRH a), or Cyo‐cpSFYFP, Mito‐cpSFYFP, Nuc‐cpSFYFP b) in response to exogenous 5 mm l‐2‐HG addition. Scale bar, 10 µm. c) Response of different subcellular localized sfLHGFRH or cpSFYFP to exogenous l‐2‐HG addition. The fluorescence ratios of sfLHGFRH and cpSFYFP before (blank column) and after (colored column) addition of 5 mm l‐2‐HG were recorded. Data were normalized to the ratio before l‐2‐HG addition (n = 35 cells). d) Subcellular distribution of l‐2‐HG measured by sfLHGFRH. Data were corrected by cpSFYFP and normalized to the ratio of Cyo‐sfLHGFRH (n = 74 cells). e) Identification of ME2 function using sfLHGFRH. The fluorescence ratios of sfLHGFRH with (colored column) or without (blank column) ME2 overexpression were recorded. Data were normalized to the control (n = 19 cells). All data shown are means ± s.d. *** p < 0.001; ns, no significant difference (p ≥ 0.05) in the two‐tailed t‐test.
Figure 6
Figure 6
Analysis of mitochondrial l‐2‐HG transport using sfLHGFRH. a) Schematic representation of the mechanisms of l‐2‐HG metabolism, transport, and functions in mammalian cells. KDM, histone lysine demethylase. TET, 5‐methylcytosine hydroxylase. ALKBH, DNA repair enzyme. This figure was generated using BioRender. b) Molecular docking result of SLC1A1 with l‐2‐HG. The interacting amino acid residues were shown. c,d) Response of Cyo‐sfLHGFRH c) and Mito‐sfLHGFRH d) to 700 µm octyl‐l‐2‐HG. Data were corrected by cpSFYFP and normalized to the control (n = 49 cells). e–h) Analysis of SLC1A1 function in mitochondrial l‐2‐HG uptake. The fluorescence ratios of Cyto‐sfLHGFRH e), Cyto‐cpSFYFP f), Mito‐sfLHGFRH g), and Mito‐cpSFYFP h) were determined 48 h after SLC1A1 knockdown. 700 µm octyl‐l‐2‐HG was added 12 h before imaging. Data were normalized to the control condition treated with negative siRNA (n = 49 cells). i–l) Analysis of SLC1A1 function in mitochondrial l‐2‐HG efflux. The fluorescence ratios of Cyto‐sfLHGFRH i), Cyto‐cpSFYFP j), Mito‐sfLHGFRH k), and Mito‐cpSFYFP l) were determined 48 h after L2HGDH and SLC1A1 knockdown. Data were normalized to the control condition treated with negative siRNA (n = 42 cells). All data shown are means ± s.d. *** p < 0.001; ns, no significant difference (p ≥ 0.05) in the two‐tailed t‐test.
Figure 7
Figure 7
Quantification of l‐2‐HG in human body fluids using sfLHGFRL. a) Schematic representation of the development of sfLHGFRL. b) Comparison of the dose‐response curves of sfLHGFRL‐1, sfLHGFRL‐2, sfLHGFRL‐3, and sfLHGFRL for l‐2‐HG. Data were normalized to the initial ratio. c,d) Comparison of the fluorescence intensities of sfLHGFRL‐1, sfLHGFRL‐2, sfLHGFRL‐3, and sfLHGFRL with excitation at 488 nm c) and 405 nm d). Data were normalized to the fluorescence intensity of sfLHGFRL‐1 in the absence of l‐2‐HG. e) Schematic representation of the workflow for sfLHGFRL‐based l‐2‐HG detection in human body fluids. This figure was generated using BioRender. f,g) Dose‐response curves of sfLHGFRL for increasing concentrations of l‐2‐HG in serum f) and urine g). h) Comparison between the quantitative results of l‐2‐HG in serum by sfLHGFRL and LC‐MS/MS. Gray dotted line indicated a reference line with a slope of 1. i) The difference in serum l‐2‐HG concentrations measured by sfLHGFRL and LC‐MS/MS. j) Comparison between the quantitative results of l‐2‐HG in urine by sfLHGFRL and LC‐MS/MS. k) The difference in urine l‐2‐HG concentrations measured by sfLHGFRL and LC‐MS/MS. l) Bland–Altman analysis for l‐2‐HG in serum samples from healthy adults and patients with kidney cancer measured by sfLHGFRL and LC‐MS/MS. Bias (gray dotted line) and 95% limits of agreement (red dotted lines) were shown. m) Comparison of individual l‐2‐HG concentrations in serum samples measured by sfLHGFRL. n) Bland–Altman analysis for l‐2‐HG in urine samples from healthy adults and patients with kidney cancer measured by sfLHGFRL and LC‐MS/MS. o) Comparison of individual l‐2‐HG concentrations in urine samples measured by sfLHGFRL. All data shown are means ± s.d. (n ≥ 3 independent experiments for b‐k; n = 14 and seven samples from healthy adults and patients with kidney cancer for l–o). * p < 0.05; ns, no significant difference (p ≥ 0.05) in the two‐tailed t‐test.

Similar articles

Cited by

References

    1. Ye D., Guan K. L., Xiong Y., Trends Cancer 2018, 4, 151. - PMC - PubMed
    1. Harris A. L., Cell Metab. 2015, 22, 198. - PubMed
    1. Intlekofer A. M., Dematteo R. G., Venneti S., Finley L. W., Lu C., Judkins A. R., Rustenburg A. S., Grinaway P. B., Chodera J. D., Cross J. R., Thompson C. B., Cell Metab. 2015, 22, 304. - PMC - PubMed
    1. Oldham W. M., Clish C. B., Yang Y., Loscalzo J., Cell Metab. 2015, 22, 291. - PMC - PubMed
    1. Tyrakis P. A., Palazon A., Macias D., Lee K. L., Phan A. T., Veliça P., You J., Chia G. S., Sim J., Doedens A., Abelanet A., Evans C. E., Griffiths J. R., Poellinger L., Goldrath A. W., Johnson R. S., Nature 2016, 540, 236. - PMC - PubMed

LinkOut - more resources