. 2024 Jul 12;4(7):2944-2956.
doi: 10.1021/acsestwater.4c00134. Epub 2024 Jun 24.

Model-Based Analysis of Arsenic Retention by Stimulated Iron Mineral Transformation under Coastal Aquifer Conditions

Affiliations

Model-Based Analysis of Arsenic Retention by Stimulated Iron Mineral Transformation under Coastal Aquifer Conditions

Alyssa Barron et al. ACS ES T Water. .

Abstract

A multitude of geochemical processes control the aqueous concentration and transport properties of trace metal contaminants such as arsenic (As) in groundwater environments. Effective As remediation, especially under reducing conditions, has remained a significant challenge. Fe(II) nitrate treatments are a promising option for As immobilization but require optimization to be most effective. Here, we develop a process-based numerical modeling framework to provide an in-depth understanding of the geochemical mechanisms controlling the response of As-contaminated sediments to Fe(II) nitrate treatment. The analyzed data sets included time series from two batch experiments (control vs treatment) and effluent concentrations from a flow-through column experiment. The reaction network incorporates a mixture of homogeneous and heterogeneous reactions affecting Fe redox chemistry. Modeling revealed that the precipitation of the Fe treatment caused a rapid pH decline, which then triggered multiple heterogeneous buffering processes. The model quantifies key processes for effective remediation, including the transfer of aqueous As to adsorbed As and the transformation of Fe minerals, which act as sorption hosts, from amorphous to more stable phases. The developed model provides the basis for predictions of the remedial benefits of Fe(II) nitrate treatments under varying geochemical and hydrogeological conditions, particularly in high-As coastal environments.

Keywords: arsenic remediation; coastal aquifer; geochemical modeling; in situ mineral transformation.


Conflict of interest statement

Notes The authors declare no competing financial interest.

Figures

Figure 1.
Figure 1.
Batch solution chemistry (mM) over time (days) in treatment (teal) and control (gray) microcosms for pH (top left), dissolved Fe (top right), total alkalinity (bottom left), and dissolved calcium (bottom right). Yellow circles depict day 0 solution concentrations only, i.e., prior to sediment equilibrium. Orange circles depict applied treatment concentrations (i.e., not solution-measured concentrations).
Figure 2.
Figure 2.
Comparison of solution chemistry (mM) and mineral concentrations (mM) over time (days) in the batch treatment model (solid, teal) to simulations omitting the incorporation of the following processes: proton buffering by generic sites (dashed orange), calcite dissolution (solid yellow), CO2 degassing (solid gray), or O2 ingress (dashed green). Observed data are shown by the solid teal circles.
Figure 3.
Figure 3.
Batch solution chemistry (mM) over time (days) in treatment (teal) and control (gray) microcosms for NO3 (left), NO2 (middle), and SO42− (right). Yellow circles depict day 0 solution concentrations only, i.e., prior to sediment equilibrium. Orange circles depict applied treatment concentrations (i.e., not solution-measured concentrations).
Figure 4.
Figure 4.
Dissolved As concentrations (mM) over time (days) in treatment (left) and control (right) microcosms. Observed data are shown by the solid teal circles. Yellow circles depict day 0 solution concentrations only, i.e., prior to sediment equilibrium. Manually calibrated and PEST++ simulated results are shown as teal dashed and solid lines, respectively. The yellow solid line shows the absence of CO32− in the SCM. The orange dashed line shows the absence of Ca2+ in the SCM. Inclusion of PO43− and SO42− is not shown, as they remain the same as PEST++ simulated.
Figure 5.
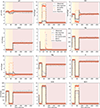
Figure 5.
Column model solution chemistry. The background depicts the active phase being solution 1 (yellow), solution 2 (orange), or solution 3 (pink). Plots show observed data (white circles), conservative simulation (gray dashed), no generic buffer simulation (pale orange dashed), the initial batch parameter simulation (dark orange dotted), and reactive simulation (solid gray). The arsenic plot also depicts the simulation excluding CaCO3 in the SCM (purple stars).

Similar articles

References

    1. Dixit S; Hering JG Comparison of Arsenic(V) and Arsenic(III) Sorption onto Iron Oxide Minerals: Implications for Arsenic Mobility. Environ. Sci. Technol. 2003, 37 (18), 4182–4189. - PubMed
    1. Faria M; Hott R; Santos M; Santos M; Andrade T; Bomfeti C; Rocha B; Barbosa F; Rodrigues J Arsenic in Mining Areas: Environmental Contamination Routes. Int. J. Environ. Res. Public Health 2023, 20 (5), No. 4291. - PMC - PubMed
    1. Dregulo A; Bobylev N Heavy Metals and Arsenic Soil Contamination Resulting from Wastewater Sludge Urban Landfill Disposal. Pol. J. Environ. Stud. 2021, 30 (1), 81–89.
    1. Lack JG; Chaudhuri SK; Kelly SD; Kemner KM; O’Connor SM; Coates JD Immobilization of Radionuclides and Heavy Metals through Anaerobic Bio-Oxidation of Fe(II. Appl. Environ. Microbiol. 2002, 68 (6), 2704–2710. - PMC - PubMed
    1. Prommer H; Sun J; Helm L; Rathi B; Siade AJ; Morris R Deoxygenation Prevents Arsenic Mobilization during Deepwell Injection into Sulfide-Bearing Aquifers. Environ. Sci. Technol. 2018, 52 (23), 13801–13810. - PubMed

LinkOut - more resources