[Preprint]. 2024 Jul 3:2024.07.01.601474.
doi: 10.1101/2024.07.01.601474.

The Neurolipid Atlas: a lipidomics resource for neurodegenerative diseases uncovers cholesterol as a regulator of astrocyte reactivity impaired by ApoE4

Affiliations

The Neurolipid Atlas: a lipidomics resource for neurodegenerative diseases uncovers cholesterol as a regulator of astrocyte reactivity impaired by ApoE4

Femke M Feringa et al. bioRxiv. .

Abstract

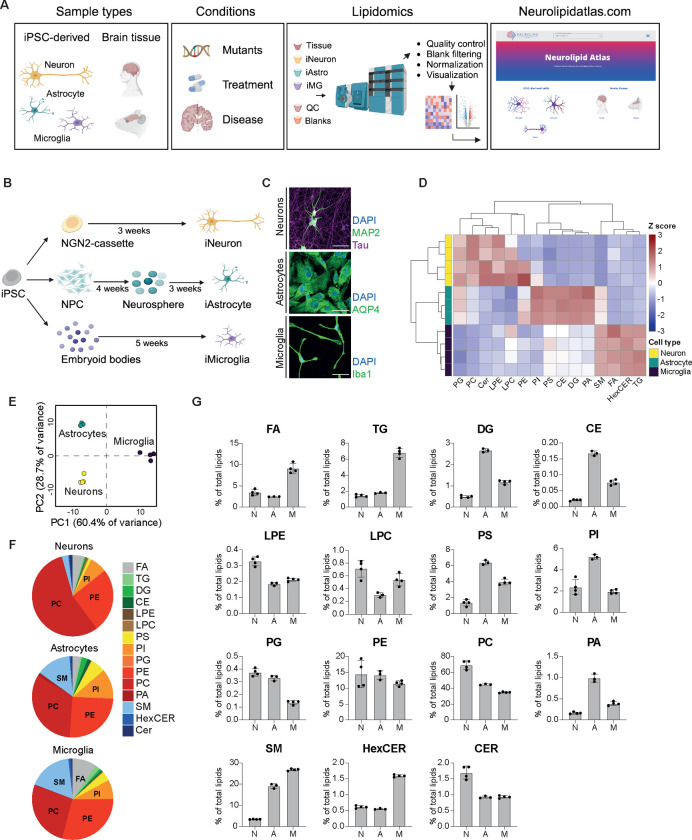
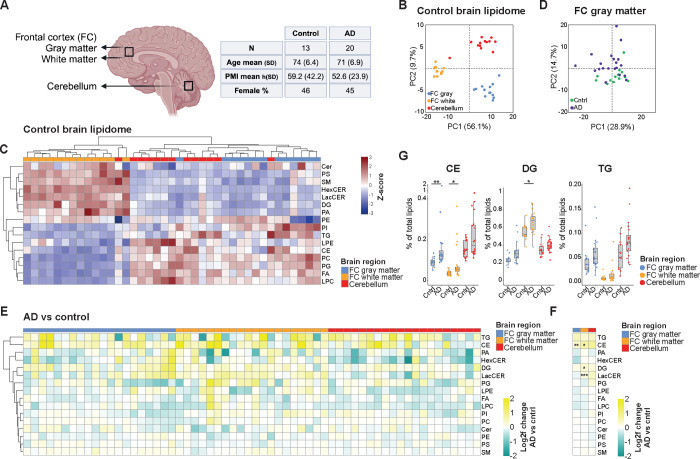
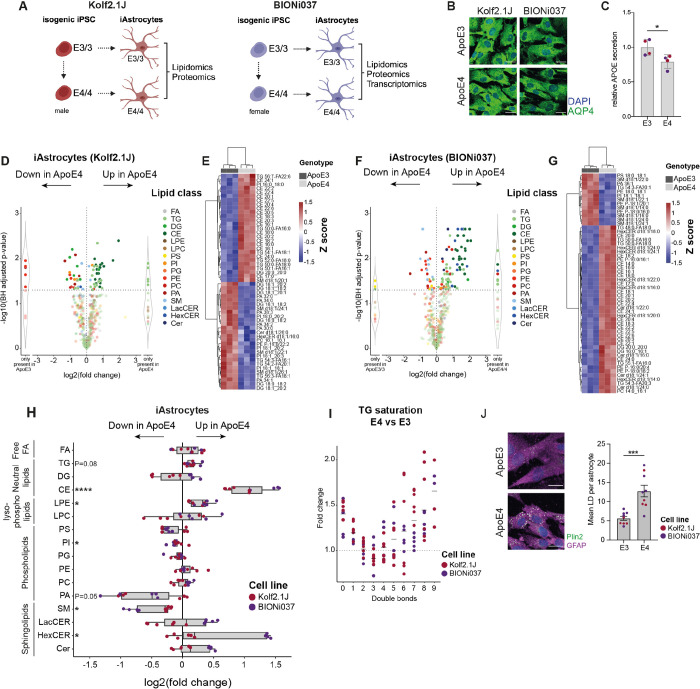
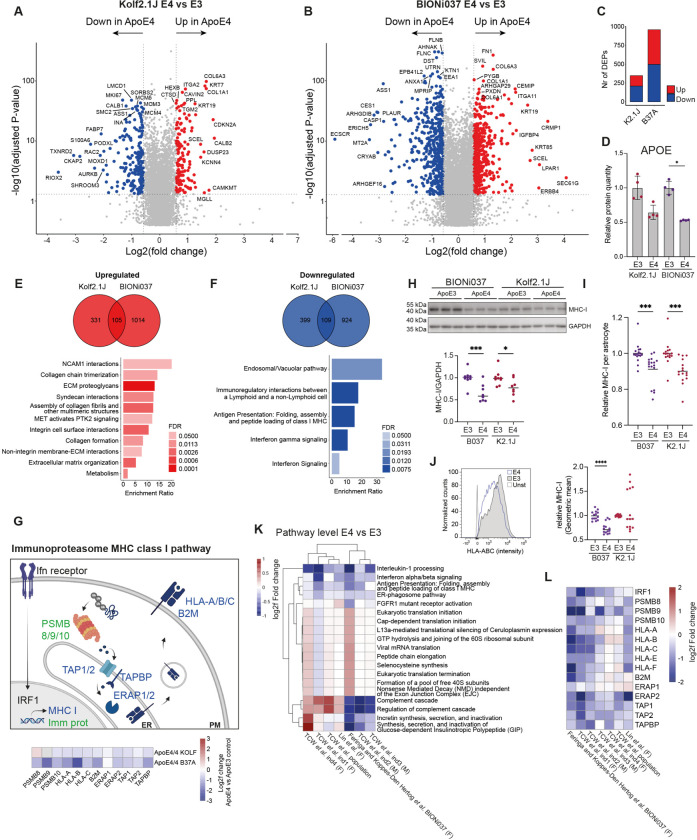
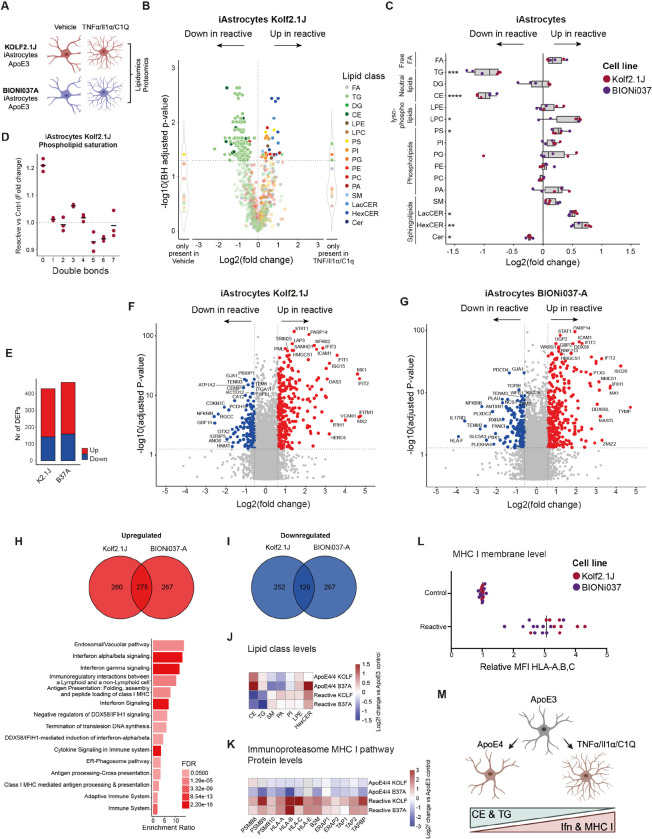
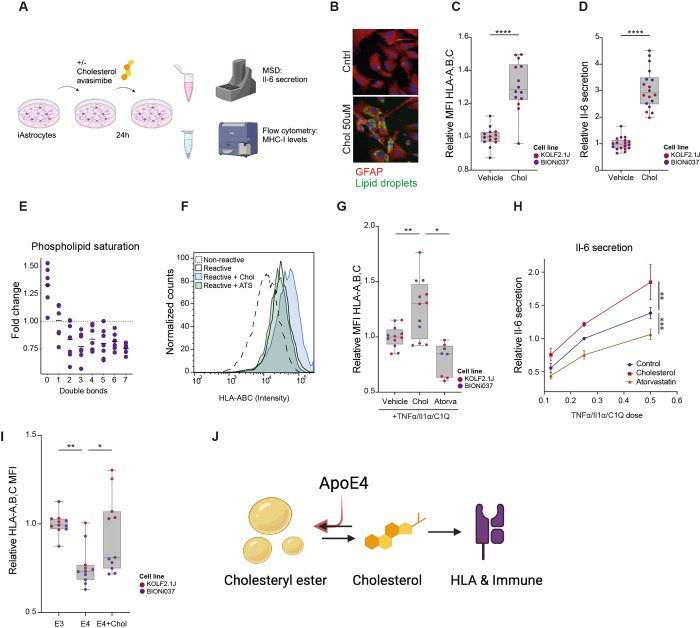
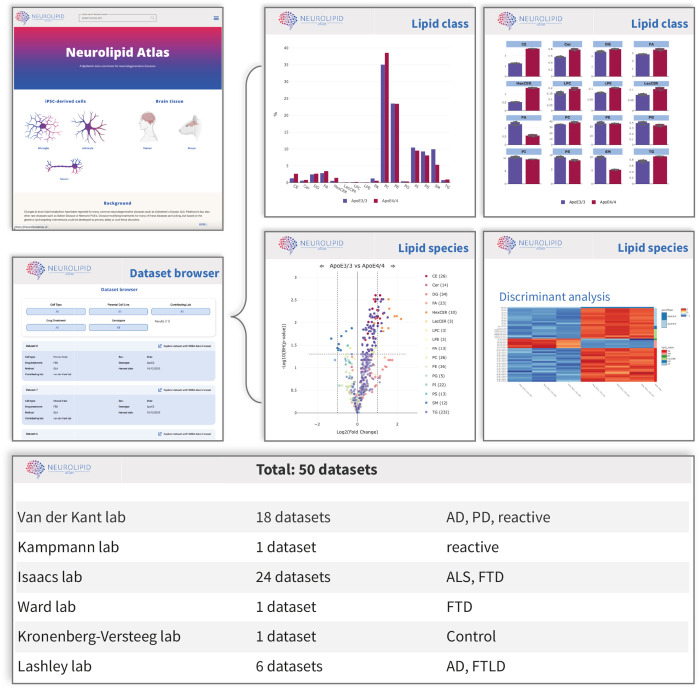
Lipid changes in the brain have been implicated in many neurodegenerative diseases including Alzheimer's Disease (AD), Parkinson's disease and Amyotrophic Lateral Sclerosis. To facilitate comparative lipidomic research across brain-diseases we established a data commons named the Neurolipid Atlas, that we have pre-populated with novel human, mouse and isogenic induced pluripotent stem cell (iPSC)-derived lipidomics data for different brain diseases. We show that iPSC-derived neurons, microglia and astrocytes display distinct lipid profiles that recapitulate in vivo lipotypes. Leveraging multiple datasets, we show that the AD risk gene ApoE4 drives cholesterol ester (CE) accumulation in human astrocytes recapitulating CE accumulation measured in the human AD brain. Multi-omic interrogation of iPSC-derived astrocytes revealed that cholesterol plays a major role in astrocyte interferon-dependent pathways such as the immunoproteasome and major histocompatibility complex (MHC) class I antigen presentation. We show that through enhanced cholesterol esterification ApoE4 suppresses immune activation of astrocytes. Our novel data commons, available at neurolipidatlas.com, provides a user-friendly tool and knowledge base for a better understanding of lipid dyshomeostasis in neurodegenerative diseases.


Figures

Figure 1.
Figure 1.. Lipotypes of human iPSC-derived neurons, astrocytes and microglia
A) Schematic overview of the Neurolipid Atlas work-flow and resource. B) Schematic overview of iPSC differentiation protocols. C) Representative confocal microscopy image of iPSC-derived neurons, astrocytes and microglia in monoculture. Scale bar = 50mm. D) Heatmap of Z scored lipid class abundance in iPSC-derived neurons, astrocytes and microglia (BIONi037-A parental line). E) PCA analysis of iPSC-derived brain cell lipotypes. F) Pie charts showing relative abundance of all detected lipid classes in the iPSC-derived brain cell types. G) Bar graphs present individual lipid class levels in each cell type, normalized to total lipid level. N (Neurons) n=4 wells, A (Astrocytes) n=3 wells, M (Microglia) n=4 wells. Mean + SD.
Figure 2.
Figure 2.. Human (AD) brain lipidomics
A) Schematic overview of human postmortem brain tissue sampled and summary of subject characteristics. Metadata for individual patients can be found in the methods section. B) PCA plot of unbiased lipidomic analysis from indicated brain areas (control group subjects only). C) Heatmap shows Z scored relative lipid class abundance (control group) per brain regions. D) PCA plot of unbiased lipidomic analysis of AD (purple) and control (green) brain tissue samples from frontal cortex (FC) gray matter. E) Heatmap depicting changes (log2fold AD subject vs average control group) at the lipid class level for each individual AD subject and each brain area. AD patient samples are ordered 1–20 from left to right in each brain area (see methods for metadata) F) Average log2fold change of lipid classes in all AD brain samples compared to control samples per brain area. G) Changes in levels of CE, DG and TG (neutral) lipid species in control versus AD group. Mann-Whitney U test with Benjamini-Hochberg correction *=P<0.05. All lipid values in this figure are plotted as % of total lipids, raw concentration can be found in Supplementary figure 2.
Figure 3.
Figure 3.. Lipidomic analysis of human isogenic APOE3/3 and APOE4/4 iPSC-derived astrocytes
A) Schematic overview of our multi-omics workflow with two independent isogenic iPSC-lines. B) Representative image of differentiated iAstrocytes from BIONi037 and Kolf2.1J background. Scale bar = 25mm C) Relative ApoE level secreted in the medium. n=4 wells from 2 independent lines. Mean + SD. *=P<0.05 t-test. D-G) Log2fold change of altered lipid species in BIONi037 (D) and Kolf2.1J (F) ApoE4 vs ApoE3 iAstrocytes. n=3 wells per genotype and heatmap of most differentiating lipid species between ApoE4 and ApoE3 iAstrocytes in BIONi037 (E) and Kolf2.1J lines (G) H) Summary data of changes in all detected lipid classes in ApoE4 vs ApoE3 iAstrocytes. n=6 samples per iPSC-line from 2 independent lipidomics experiments. Mann-Whitney U test with Benjamini-Hochberg correction *=P<0.05. I) Fold change in Triacylglycerides with indicated number of double bonds (unsaturation) in ApoE4 vs ApoE3 iAstrocytes. J) Representative image and quantification of the average lipid droplet number per astrocyte based on Plin2 staining. n=9 wells with E3 and E4 astrocytes (n=5 BIONi037, n=4 Kolf2.1J combined) from 2 independent experiments. Each datapoint represents a mean of >500 cells per well. Mean + sem. ***=P<0.0001 t-test.
Figure 4.
Figure 4.. Proteomic and transcriptomic analysis of human isogenic APOE3/3 and APOE4/4 iPSC-derived astrocytes.
A-B) Log2fold changes in protein levels in ApoE4 vs ApoE3 iAstrocytes from Kolf2.1J (A) and BIONI037 (B). Top ten proteins with highest log2fold change and top ten proteins with most significant P-value are labeled. n=4 wells per genotype. C) Number of DEPs (fold change > 1.5 & FDR <0.05) detected in ApoE4 vs ApoE3 iAstrocytes of Kolf2.1J or BIONi037 isogenic sets. D) Relative ApoE protein levels in ApoE3 and ApoE4 iAstrocytes (from proteomic analysis) from BIONi037 and Kolf2.1J background. Mean + SD *P<0.05 Mann-Whitney U test. E-F) Venn diagrams depicting the number of DEPs significantly upregulated (E) or downregulated (F) >1.25 fold times (>0.3 log2fold) in Kolf2.1J, BIONI037 or both ApoE4 iAstrocytes. A reactome overrepresentation analysis was performed on the 105 common upregulated (E) or 109 common downregulated (F) proteins and the enrichment ratio was plotted for all significant pathways (FDR <0.05). G) Schematic overview of interferon-dependent regulation of MHC class I antigen presentation (in blue) and immunoproteasome (in green) pathways. Heatmap indicated log2fold change of indicated proteins in ApoE4 vs ApoE3 iAstrocytes. PM = plasma membrane, ER = endoplasmic reticulum. H) Representative western blot and quantification of MHC-I levels (anti-HLA Class I Heavy Chain) in ApoE4 van ApoE3 iAstrocytes. BIONi037 (B037) and Kolf2.1J (K2.1J). n=8 wells from 3 independent experiments per line. Mean ***P<0.001 Mann-Whitney U test. I) Quantification of intracellular MHC-I levels as measured by immune fluorescence microscopy (stained for HLA-A,B,C). n=17 (B037) n=18 (K2.1J) wells from 6 independent experiments per line. Mean ***P<0.001 Mann-Whitney U test. J) Representative histogram (BIONi037) and quantification of plasma membrane MHC-I levels (stained for anti-HLA Class I Heavy Chain) by flowcytometry. Unst = unstained control. n=14 wells from 6 independent experiments per line. Mean ***P<0.001 Mann-Whitney U test. K) Comparison of significant reactome pathways (by gene-set enrichment analysis) from our transcriptomic analysis of ApoE4 vs ApoE3 (BIONi037) astrocytes with previously published datasets. Shown is the average log2fold change of all genes in the indicated pathway. TCW et al. ind1–4 (four different isogenic sets) and population (ctrl vs ApoE4 subjects) represent iPSC-derived astrocytes from 10, Lin et al. represents one isogenic set of ApoE4 vs ApoE3 iPSC-derived astrocytes from 8. (F)=Female (M)=Male L) Heatmap shows the log2fold change in individual genes in the MHC I and immunoproteasome pathway across indicated studies, including our data here. (F)=Female (M)=Male
Figure 5.
Figure 5.. Lipidomics and proteomic analysis of reactive human iPSC-derived astrocytes
A) Schematic overview of experimental design, a cocktail of TNF/Il-1a/C1q was added for 24h hours to make astrocytes reactive. B) Log2fold change of altered individual lipid species in reactive vs control iAstrocytes (Kolf2.1J ApoE3). n=3 wells per condition. C) Fold change of all phospholipid species with indicated number of double bonds (unsaturation) in reactive vs control iAstrocytes (Kolf2.1J ApoE3). D) Summary data of changes in all detected lipid classes in reactive vs control iAstrocytes. n=3 wells per line. Mann-Whitney U test with Benjamini-Hochberg correction *=P<0.05. E) Number of DEPs (fold change > 1.5 & FDR <0.05) in reactive vs control iAstrocytes for indicated lines F-G) Log2fold changes in protein levels of reactive vs control iAstrocytes for Kolf2.1J (F) and BIONi037 (G). Top ten proteins with highest log2fold change and top ten proteins with highest P-value are labeled. n=4 wells per genotype. H) Venn diagram depicting the number of proteins that were significantly upregulated (H) or downregulated (I) >1.25 fold (>0.3 log2fold) in reactive Kolf2.1J, BIONi037 and both iAstrocytes. A reactome overrepresentation analysis was performed on the 275 common upregulated or 129 common downregulated proteins. No significantly enriched downregulatd pathways were observed, the enrichment ratios for all significantly (FDR<0.05) upregulated pathways are plotted in H. J) Heatmap depicting the log2fold change of indicated lipid classes (changed in ApoE4 iAstrocytes with P<0.1) in ApoE4 or reactive astrocytes vs ApoE3 control iAstrocytes. K) Heatmap depicting the log2fold change of indicated proteins from the MHC class I and immunoproteasome pathway in ApoE4 or reactive astrocytes vs ApoE3 control iAstrocytes. (Based on proteomics data) L) Relative membrane MHC-I levels (stained for anti-HLA Class I Heavy Chain) by flowcytometry in reactive vs control iAstrocytes. n=11 wells BIONi37 from 5 independent experiments and n=9 wells Kolf2.1J from 4 independent experiments. ****p<0.0001 unpaired t-test. M) Schematic representation of opposing lipidomic and proteomic phenotypes in ApoE4 and reactive iAstrocytes.
Figure 6.
Figure 6.. Cholesterol regulates activation of human astrocytes
A) Schematic representation of the experimental design. B) Lipid droplet staining in iAstrocytes following 24h treatment with cholesterol. C) Normalized membrane MHC-I levels (stained for anti-HLA Class I Heavy Chain) in vehicle versus cholesterol treated ApoE3 iAstrocytes determined by flow cytometry. n=6 (K2.1J) and n=8 (B037) from 4 independent experiments. ****P<0.0001 Unpaired t-test. D) Normalized Il-6 secretion in vehicle versus cholesterol treated ApoE3 iAstrocytes n=6 (K2.1J) and n=12 (B037) from 4 independent experiments. ****P<0.0001 Unpaired t-test. E) Fold change of phospholipid species with indicated number of double bonds (unsaturation) in cholesterol treated vs control iAstrocytes (BIONi037 ApoE3). n=6 wells from 3 independent experiments. F-G) Representative histogram and quantification (G) of normalized MHC-I membrane levels determined by flow cytometry (stained for anti-HLA Class I Heavy Chain) in response to indicated treatment conditions in iAstrocytes. n=6 (K2.1J) and n=6 (B037) wells from 3 independent experiments per line. *P<0.05 One-way ANOVA with Dunnett’s multiple comparison correction. H) Secreted Il-6 levels in medium of ApoE3 iAstrocytes that were pre-treated with vehicle, exogenous cholesterol (10mM) or atorvastatin (0.5mM for one hour and then treated for 24 hours with increasing doses of TNF/Il-1α/C1q (in presence of vehicle, atorvastatin or exogenous cholesterol). n=5 biological replicates (n=2 Kolf2.1J and n=3 BIONi037). **p<0.01 intercept difference by linear regression model. Relative Il-6 levels with vehicle 0.25 times cocktail dose set at 1. I) Relative changes in membrane MHC-I levels determined by flow cytometry (stained for anti-HLA Class I Heavy Chain) in ApoE3 or ApoE4 iAstrocytes treated with cholesterol. n=6 (K2.1J) and n=6 (B037) wells from 3 independent experiments. BIONi037 (B037) and Kolf2.1J (K2.1J). J) ApoE4 decreases HLA expression and immune function in human glia by increased cholesterol storage in cholesteryl esters.
Figure 7.
Figure 7.. The neurolipid Atlas:
Overview of the Neurolipid Atlas data commons (https://neurolipidatlas.com) to explore all lipidomics datasets from this study. Representative images of the start page, data browser as well as examples of bargraphs, volcano plot or heatmap for visualization of changes in lipid class or species levels between selected conditions. In addition, a summary list of currently available datasets is shown.

Similar articles

References

    1. Yoon J. H. et al. Brain lipidomics: From functional landscape to clinical significance. Sci. Adv. 8, 9317 (2022). - PMC - PubMed
    1. Kollmann K. et al. Cell biology and function of neuronal ceroid lipofuscinosis-related proteins. Biochim. Biophys. Acta 1832, 1866–1881 (2013). - PubMed
    1. Vance J. E. Lipid imbalance in the neurological disorder, Niemann-Pick C disease. FEBS Lett. 580, 5518–5524 (2006). - PubMed
    1. Chan R. B. et al. Comparative Lipidomic Analysis of Mouse and Human Brain with Alzheimer Disease. J. Biol. Chem. 287, 2678–2688 (2012). - PMC - PubMed
    1. de Leeuw S. M. et al. APOE2, E3, and E4 differentially modulate cellular homeostasis, cholesterol metabolism, and inflammatory response in isogenic iPSC-derived astrocytes. Stem Cell Reports 17, 110 (2022). - PMC - PubMed

Publication types