[Preprint]. 2024 Jul 5:2024.07.03.602003.
doi: 10.1101/2024.07.03.602003.

Postprandial sleep in short-sleeping Mexican cavefish

Affiliations

Postprandial sleep in short-sleeping Mexican cavefish

Kathryn Gallman et al. bioRxiv. .

Update in

  • Postprandial Sleep in Short-Sleeping Mexican Cavefish.
    Gallman K, Rastogi A, North O, O'Gorman M, Hutton P, Lloyd E, Warren WC, Kowalko JE, Duboue ER, Rohner N, Keene AC. Gallman K, et al. J Exp Zool A Ecol Integr Physiol. 2024 Dec;341(10):1084-1096. doi: 10.1002/jez.2880. Epub 2024 Nov 13. J Exp Zool A Ecol Integr Physiol. 2024. PMID: 39539086 Free PMC article.

Abstract

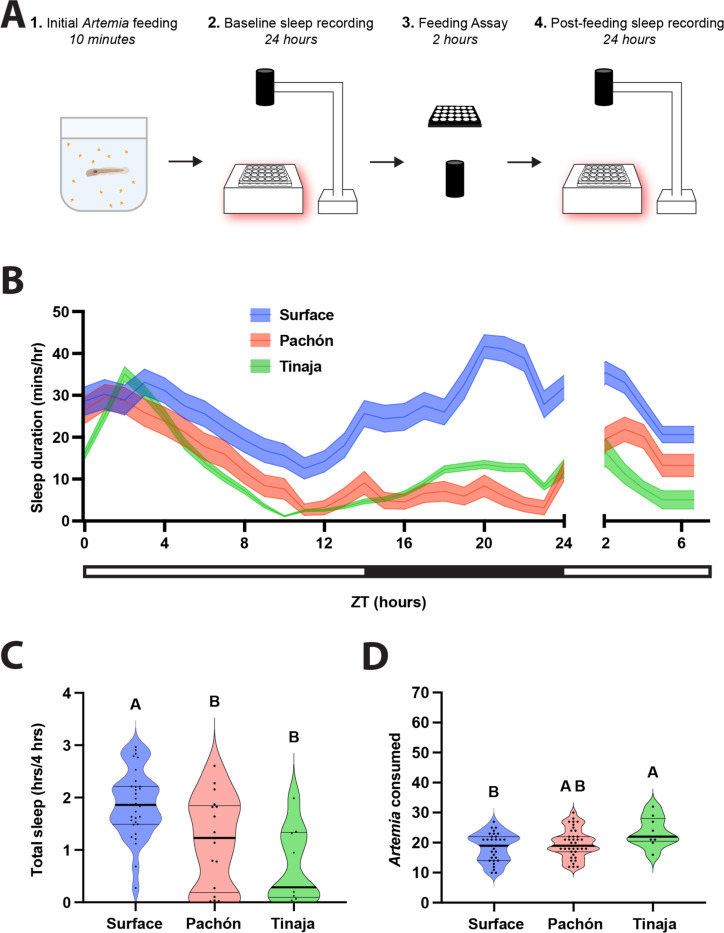
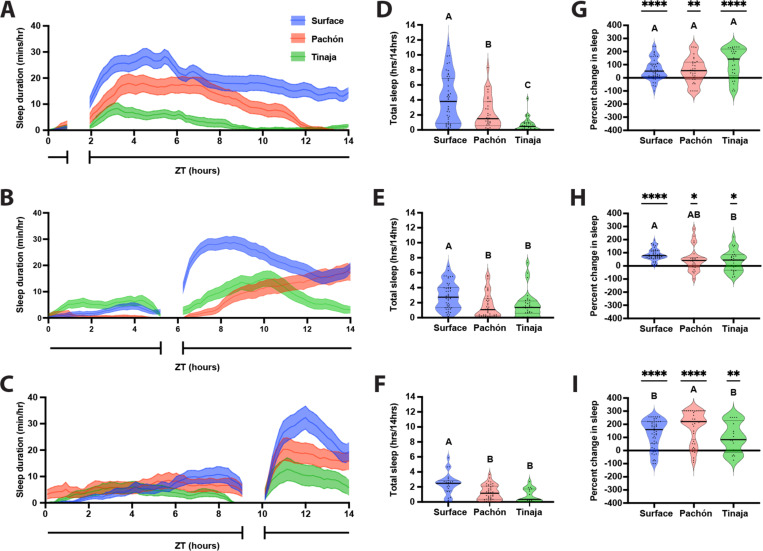
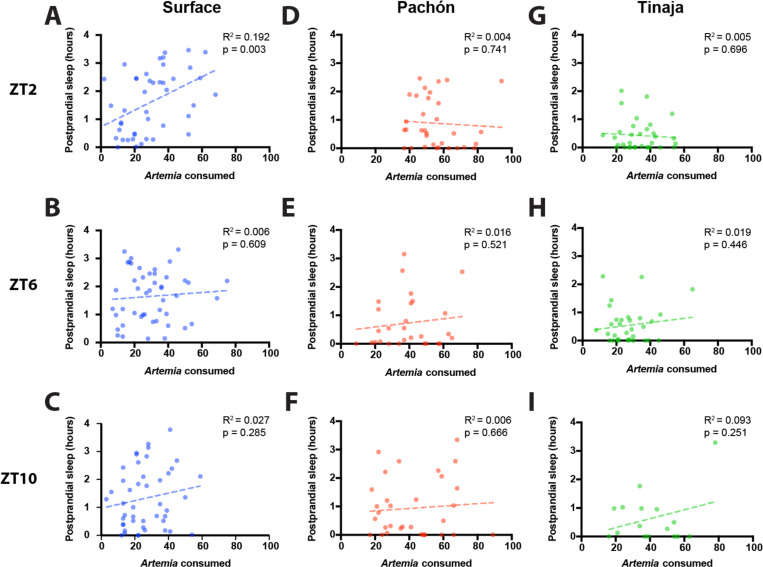
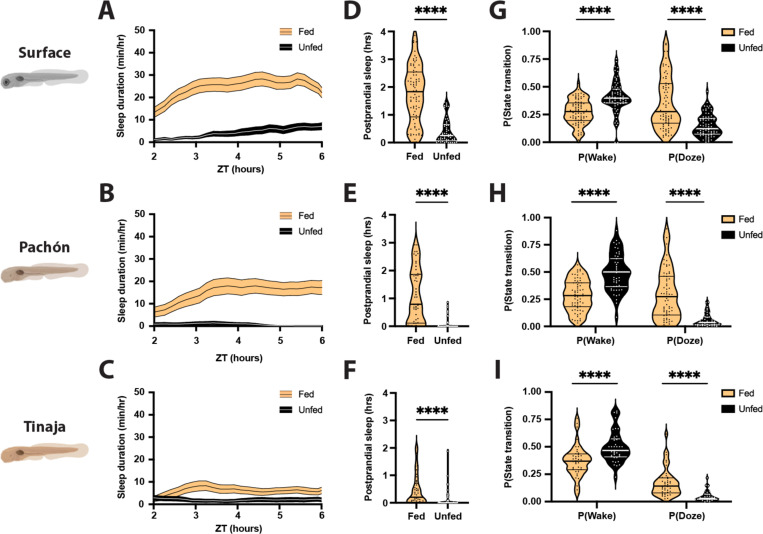
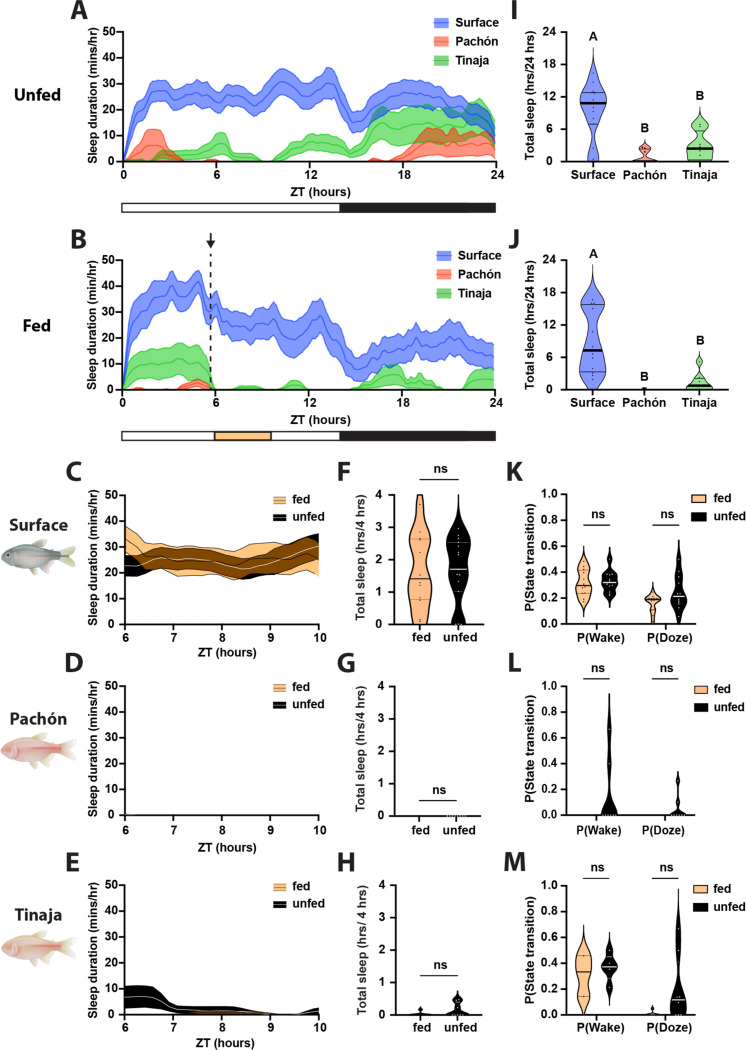
Interaction between sleep and feeding behaviors are critical for adaptive fitness. Diverse species suppress sleep when food is scarce to increase the time spent foraging. Post-prandial sleep, an increase in sleep time following a feeding event, has been documented in vertebrate and invertebrate animals. While interactions between sleep and feeding appear to be highly conserved, the evolution of postprandial sleep in response to changes in food availability remains poorly understood. Multiple populations of the Mexican cavefish, Astyanax mexicanus, have independently evolved sleep loss and increased food consumption compared to surface-dwelling fish of the same species, providing the opportunity to investigate the evolution of interactions between sleep and feeding. Here, we investigate effects of feeding on sleep in larval and adult surface fish, and two parallelly evolved cave populations of A. mexicanus. Larval surface and cave populations of A. mexicanus increase sleep immediately following a meal, providing the first evidence of postprandial sleep in a fish model. The amount of sleep was not correlated to meal size and occurred independently of feeding time. In contrast to larvae, postprandial sleep was not detected in adult surface or cavefish, that can survive for months without food. Together, these findings reveal that postprandial sleep is present in multiple short-sleeping populations of cavefish, suggesting sleep-feeding interactions are retained despite the evolution of sleep loss. These findings raise the possibility that postprandial sleep is critical for energy conservation and survival in larvae that are highly sensitive to food deprivation.


Figures

Figure 1.
Figure 1.. Sleep, feeding, and post-prandial sleep behaviors across three populations of wild-type Astyanax mexicanus.
A) 20 dpf fish were briefly fed prior to 24 h behavioral sleep recordings. At ZT0 the following day, fish were assayed for feeding behavior until ZT2, immediately after which we recorded sleep behaviors between ZT2 and 6. B) Sleep profiles of wild type surface, Pachón, and Tinaja fish taken over the experiment. Lines and error bars represent the mean ± SD. C) Cross-population comparison of total sleep duration immediately following the feeding experiment. Cavefish slept significantly less than surface fish (ANOVA: F2, 34 = 8.123, p = 0.0013; Tukey’s HSD for surface-Pachón, p = 0.0202, p = 0.0024; Tukey’s HSD for surface-Tinaja, p = 0.0024). D) Cross-population comparison of the number of Artemia eaten during the two-h feeding experiment. Tinaja ate significantly more than surface fish (ANOVA: F2, 76 = 3.91, p = 0.0242; Tukey’s HSD for surface-Tinaja, p = 0.0178).
Figure 2:
Figure 2:. Post feeding increase in larval A. mexicanus sleep duration is not dependent on daily feeding time.
20 dpf larvae were fed over a 45-minute window before ZT2 (A, D, G), ZT6 (B, E, H), or ZT10 (C, F, I). A-C) Sleep profiles of Surface, Pachón, and Tinaja larvae, in minutes per hour, averaged across the daylight cycle. Lines and error bars represent the mean ± SD. D, E, F) Cross-population comparison of total sleep duration in hours over the 14-hour light cycle. Letters represent significant differences. D) Total sleep duration around a ZT2 feeding window was significantly different between populations of A. mexicanus (ANOVA: F2, 113 = 20.81, p < 0.0001). E) Total sleep duration around a ZT6 feeding window was significantly different between surface and cave populations of A. mexicanus (ANOVA: F2, 113 = 8.48, p = 0.0004; Tukey’s HSD for Surface-Pachón, p = 0.001 and Surface-Tinaja, p = 0.0069). F) Total sleep duration around a ZT10 feeding window significantly different between surface and cave populations of A. mexicanus (ANOVA: F2, 81 = 11.64, p < 0.001; Surface-Pachón, p = 0.0003; Tukey’s HSD for surface-Tinaja, p = 0.0002). G-I) Percentage change in sleep duration for the four-hour period following feeding from total day time sleep calculated as (proportion of post prandial sleep - proportion of total sleep)/proportion of total sleep. Asterisks indicate significant differences from zero percent change. Letters indicate cross population comparison. G) Percent change of postprandial sleep after ZT2 feeding window. Surface: t = 5.333, df = 45, p < 0.0001; Pachón: t = 3.192, df = 31, p = 0.0032; Tinaja: t = 5.239, df = 28, p < 0.0001. There was no significant difference across populations in the percentage of increase in postprandial sleep (Anova: F2, 104 = 3.36, p = 0.0417). H) Percent change of postprandial sleep after ZT6 feeding window. Surface: t = 13.65, df = 47, p < 0.0001; Pachón: t = 2.67, df = 23, p = 0.0137; Tinaja: t = 2.480, df = 26, p = 0.0200. There was no significant different in the percentage of increase in postprandial sleep between surface and Pachón cavefish, but surface fish had a significantly greater increase in sleep than Tinaja cavefish (ANOVA: F2, 96 = 5.758, p = 0.0072; Tukey’s HSD for surface-Tinaja, p = 0.0101). I) Percent change of postprandial sleep after ZT10 feeding window. Surface: t = 8.619, df = 52, p < 0.0001; Pachón: t = 10.27, df = 43, p < 0.0001; Tinaja: t = 3.636, df = 16, p = 0.0022. Pachón cavefish had a significantly greater percent increase in postprandial sleep than both surface and Tinaja cavefish (ANOVA: F2, 111 = 4.727, p = 0.0107; Tukey’s HSD for surface-Pachón, p = 0.0298; Tukey’s HSD for Pachón-Tinaja, p = 0.0275). For surface fish and Pachón cavefish, the percentage of increase in postprandial sleep was significantly greater after a ZT10 feeding window than at any other timepoint (Surface Anova: F2, 144 = 13.84, p < 0.0001; Pachón Anova: F2, 197 = 19.56, p < 0.0001). There were no other significant differences in the percent increase for postprandial sleep between timepoints or for Tinaja cavefish (Tinaja Anova: F2, 70 = 3.978, p = 0.0231).
Figure 3:
Figure 3:. Postprandial sleep in larval Astyanax is not dependent on the amount of food consumed, regardless of the time of day that feeding occurs.
Correlation of amount of Artemia nauplii consumed with sleep duration in the four hours following feeding with a simple linear regression for surface (A-C), Pachón (D-F), and Tinaja (G-I). A, D, G) Larvae were fed prior to ZT2. B, E, H) Larvae were fed prior to ZT6. C, F, I) Larvae were fed prior to ZT10.
Figure 4.
Figure 4.. Feeding results in robust increases in sleep duration in larval surface, Pachón, and Tinaja populations of A. mexicanus.
A-C) Four-hour sleep profiles comparing the sleep of fed (orange) and unfed (black) individuals in each population. Lines and error bars represent the mean ± SEM. D-F) Fed fish sleep significantly more during the four hours following feeding than unfed fish, regardless of the population. D) Surface: Mann-Whitney U = 524, nfed = 77, nunfed = 55, p < 0.0001. E) Pachón: Mann-Whitney U = 310.5, nfed = 52, nunfed = 47, p < 0.0001. F) Tinaja: Mann-Whitney U = 546.5, nfed = 45, nunfed = 49, p < 0.0001. G-I) Fed fish are less likely to wake while asleep, and more likely to fall asleep while awake, than unfed fish. G) Surface: P(Wake) Mann-Whitney U = 1317, nfed = 77, nunfed = 76, p < 0.0001; P(Doze) Mann-Whitney U = 1347, nfed = 77, nunfed = 75, p < 0.0001. H) Pachon: P(Wake) Mann-Whitney U = 663, nfed = 66, nunfed = 52, p < 0.0001; P(Doze) Mann-Whitney U = 802, nfed = 69, nunfed = 52, p < 0.0001. I) Tinaja: P(Wake) Mann-Whitney U = 369, nfed = 40, nunfed = 38, p < 0.0001; P(Doze) Mann-Whitney U = 229, n nfed = 40, nunfed = 34, p < 0.0001. Thin lines represent quartiles.
Figure 5:
Figure 5:. Adult Astyanax do not display post prandial sleep behavior.
A, B) Sleep profiles of adult Surface, Pachón, and Tinaja, in minutes per hour. Lines and error bars represent the mean ± SD. A, I) Fish were not fed over the course of the day. B, J) Fish were provided food from ZT5.5 (indicated by the arrow and dotted black line in B) to ZT6. I, J) Cross-population comparison of total sleep duration in hours over the 24-hour day. Letters represent significant differences. I) Total sleep duration in 24 hours was significantly different between unfed surface and cave populations of A. mexicanus ((ANOVA: F2, 28 = 15.5, p < 0.0001; Tukey’s HSD for Surface-Pachón, p < 0.0001 and Surface-Tinaja, p = 0.0015). J) Total sleep duration in was significantly different between fed surface and cave populations of A. mexicanus ((ANOVA: F2, 25 = 15.04, p < 0.0001; Tukey’s HSD for Surface-Pachón, p < 0.0001 and Surface-Tinaja, p = 0.0008). C-E) Four-hour sleep profiles comparing the sleep of fed (orange) and unfed (black) individuals in each population. Lines and error bars represent the mean ± SEM. F-H) There are no significant differences in sleep during the four hours following feeding, regardless of the population. F) Surface: Mann-Whitney U = 88, nfed = 12, nunfed = 15, p = 0.9317. G) Pachon: Mann-Whitney U = 31.5, nfed = 8, nunfed = 8, p > 0.9999. H) Tinaja: Mann-Whitney U = 22.5, nfed = 8, nunfed = 8, p > 0.2. K-M) There are no significant differences in activity state transitions between fed and unfed fish. K) Surface: P(Wake) t = 0.271, df = 22, p = 0.7888; P(Doze) t = 2.041, df = 22, p = 0.054. L) Pachon: Mann-Whitney U = 24, nfed = 8, nunfed = 8; P(Wake) p = 0.4667; P(Doze) p = 0.4667. M) Tinaja: Mann-Whitney U = 23, nfed = 8, nunfed = 8; P(Wake) p = 0.5714; P(Doze) p = 0.1319). Horizontal lines represent quartiles.

Similar articles

References

    1. Alié A., Devos L., Torres-Paz J., Prunier L., Boulet F. et al., 2018. Developmental evolution of the forebrain in cavefish: from natural variations in neuropeptides to behavior. Elife. - PMC - PubMed
    1. Anafi R. C., Kayser M. S., and Raizen D. M., 2019. Exploring phylogeny to find the function of sleep. Nat Rev Neurosci 20: 109–116. - PubMed
    1. Appelbaum L., Wang G. X., Maro G. S., Mori R., Tovin A. et al., 2009. Sleep-wake regulation and hypocretin-melatonin interaction in zebrafish. Proc Natl Acad Sci U S A 106: 21942–21947. - PMC - PubMed
    1. Arble D. M. D. M., Bass J., Behn C. D. C. D., Butler M. P. M. P., Challet E. et al., 2015. Impact of Sleep and Circadian Disruption on Energy Balance and Diabetes : A Summary of Workshop Discussions. Sleep 38: 1849–1860. - PMC - PubMed
    1. Aspiras A., Rohner N., Marineau B., Borowsky R., and Tabin J., 2015. Melanocortin 4 receptor mutations contribute to the adaptation of cavefish to nutrient-poor conditions. Proceedings of the National Academy of Sciences 112: 9688–73. - PMC - PubMed

Publication types

LinkOut - more resources