[Preprint]. 2024 Jul 3:2024.07.02.601737.
doi: 10.1101/2024.07.02.601737.

Transdiagnostic Neurobiology of Social Cognition and Individual Variability as Measured by Fractional Amplitude of Low-Frequency Fluctuation in Schizophrenia and Autism Spectrum Disorders

Affiliations

Transdiagnostic Neurobiology of Social Cognition and Individual Variability as Measured by Fractional Amplitude of Low-Frequency Fluctuation in Schizophrenia and Autism Spectrum Disorders

Soroush Bagheri et al. bioRxiv. .

Update in

Abstract

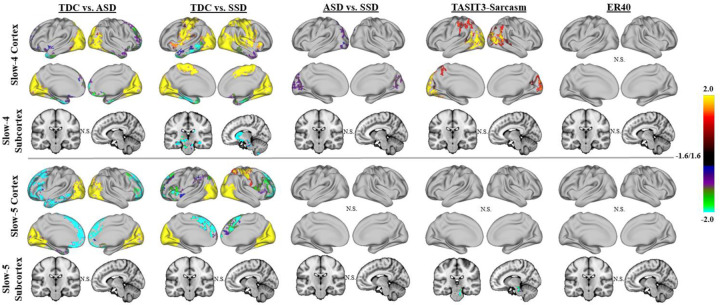
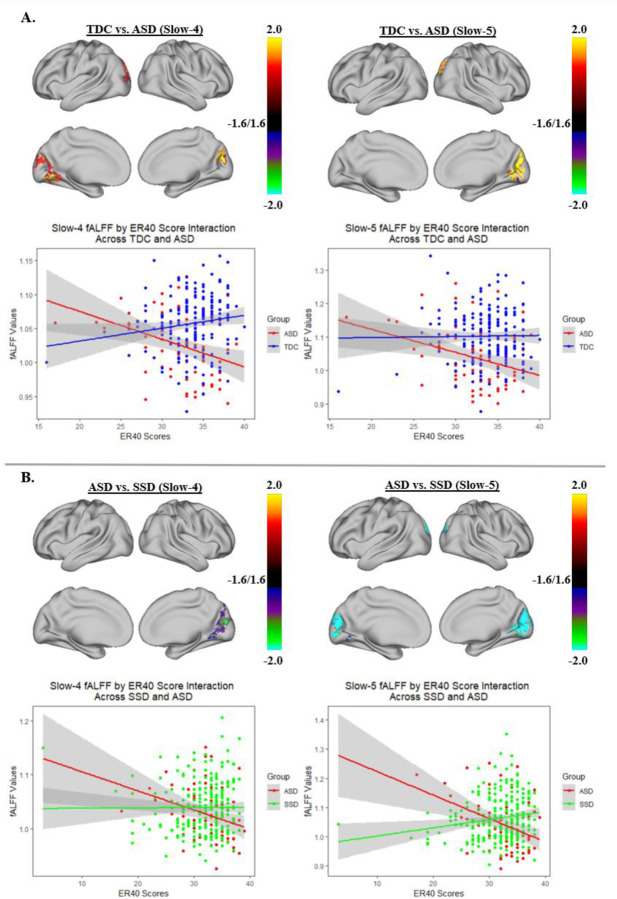
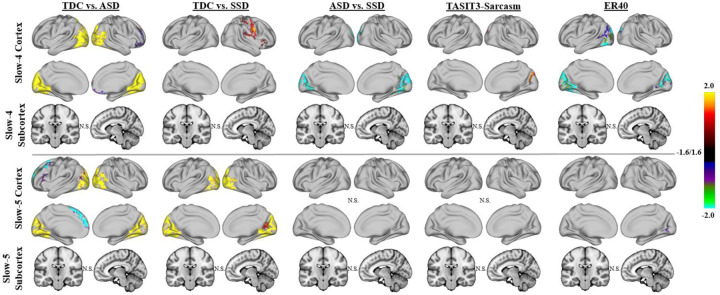
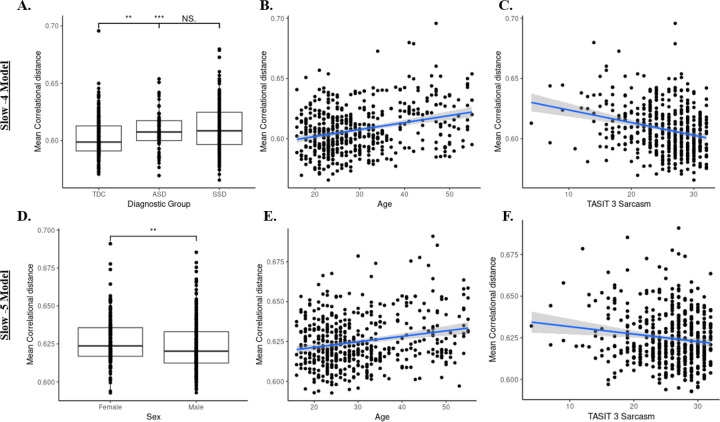
Fractional amplitude of low-frequency fluctuation (fALFF) is a validated measure of resting-state spontaneous brain activity. Previous fALFF findings in autism and schizophrenia spectrum disorders (ASDs and SSDs) have been highly heterogeneous. We aimed to use fALFF in a large sample of typically developing control (TDC), ASD and SSD participants to explore group differences and relationships with inter-individual variability of fALFF maps and social cognition. fALFF from 495 participants (185 TDC, 68 ASD, and 242 SSD) was computed using functional magnetic resonance imaging as signal power within two frequency bands (i.e., slow-4 and slow-5), normalized by the power in the remaining frequency spectrum. Permutation analysis of linear models was employed to investigate the relationship of fALFF with diagnostic groups, higher-level social cognition, and lower-level social cognition. Each participant's average distance of fALFF map to all others was defined as a variability score, with higher scores indicating less typical maps. Lower fALFF in the visual and higher fALFF in the frontal regions were found in both SSD and ASD participants compared with TDCs. Limited differences were observed between ASD and SSD participants in the cuneus regions only. Associations between slow-4 fALFF and higher-level social cognitive scores across the whole sample were observed in the lateral occipitotemporal and temporoparietal junction. Individual variability within the ASD and SSD groups was also significantly higher compared with TDC. Similar patterns of fALFF and individual variability in ASD and SSD suggest some common neurobiological deficits across these related heterogeneous conditions.


Conflict of interest statement

Competing Interest The authors declare no competing interests.

Figures

Figure 1:
Figure 1:
Group results for linear models examining fALFF across the full sample of ASD, SSD, and TDC. Results of whole-brain, vertex-wise analysis using threshold-free cluster enhancement (TFCE) are presented. Results are shown in brain-wide FWE corrected log-10(p), thresholded at 1.6, equal to p = 0.025 (to correct for left and right hemispheres). Significant differences were noted with TDC showing higher fALFF than ASD and SSD in both slow-4 and slow-5 in the visual regions (i.e. cuneus and occipital cortex; yellow-red regions); SSD also had lower fALFF than TDC in the sensory-motor cortex (yellow-red regions). Increased fALFF was observed in the SSD and ASD compared with TDC in the medial frontal regions (green-blue). SSD showed greater fALFF than TDC in the subcortical regions for slow-4 (green-blue). Higher fALFF in SSD compared with ASD was observed in the slow-4 band in the cuneus regions (purple). TASIT-3-Sar scores across the whole sample were positively associated with fALFF in the lateral occipitotemporal and temporoparietal junction in slow-4 (yellow-red) and negatively associated with slow-5 fALFF in the brainstem (green-blue). No significant association of fALFF was found with ER40 scores.
Figure 2:
Figure 2:
Group by ER40 score interaction effect for ASD compared with TDC (A) and ASD compared with SSD (B). Each of the two panels shows the areas of the cortex where there was a group by ER40 score interaction for slow 4 or slow 5 as well as a scatter plot of the relationship of fALFF and ER40 scores in the highlighted cortical regions. Overall, as ER40 scores increased, both slow 4 and slow 5 fALFF values tend to decrease in the cuneus regions for ASD but increase for SSD and TDC.
Figure 3:
Figure 3:
Group results for linear models examining fALFF across ASD, SSD, and TDC, using an age and sex-matched subsample. Higher fALFF in the visual regions in TDC compared with ASD largely persisted after matching the data for age and sex. These differences compared with SSD also persisted in slow-5 but not slow-4. In addition, after matching the data for age and sex, differences between SSD and ASD persisted whereas the association of TASIT-3-Sar and fALFF became more spatially limited. Some association of slow-4 fALFF with ER40 was also observed in the cuneus regions after matching the participants by age and sex.
Figure 4:
Figure 4:
Mean correlational distance of fALFF slow-4 and slow-5 across participants. A) Boxplots demonstrate between-diagnostic group differences in mean correlational distance of fALFF slow-4 maps. The SSD group had a marginally higher mean correlational distance than the ASD and TDC. Dots represent individual data points. (‘NS’ p>0.1, ‘***’p<0.001, ‘**’ p<0.01) B) Higher mean correlational distance of slow-4 fALFF maps was associated with older age. Dots represent individual data points. Ribbon surrounding the regression line indicates a 95% confidence interval. C) Higher mean correlational distance of slow-4 fALFF maps was associated with worse TASIT-3-Sar scores. D) Boxplots demonstrate sex differences in mean correlational distance of slow-5 fALFF maps. Females had significantly higher mean correlational distances than males. (‘**’p<0.01) E) Higher mean correlational distance of slow-5 fALFF maps was associated with older age. F) Higher mean correlational distance of slow-5 fALFF maps was associated with worse TASIT-3-Sar scores.

Similar articles

References

    1. Zeidan J, Fombonne E, Scorah J, Ibrahim A, Durkin MS, Saxena S, et al. Global prevalence of autism: A systematic review update. Autism Res. 2022;15:778–790. - PMC - PubMed
    1. Kahn RS, Sommer IE, Murray RM, Meyer-Lindenberg A, Weinberger DR, Cannon TD, et al. Schizophrenia (Primer). Nature Reviews: Disease Primers. 2015;1. - PubMed
    1. Yu-Feng Z, Yong H, Chao-Zhe Z, Qing-Jiu C, Man-Qiu S, Meng L, et al. Altered baseline brain activity in children with ADHD revealed by resting-state functional MRI. Brain and Development. 2007;29:83–91. - PubMed
    1. Zou Q-H, Zhu C-Z, Yang Y, Zuo X-N, Long X-Y, Cao Q-J, et al. An improved approach to detection of amplitude of low-frequency fluctuation (ALFF) for resting-state fMRI: fractional ALFF. J Neurosci Methods. 2008;172:137–141. - PMC - PubMed
    1. Hoptman MJ, Zuo X-N, Butler PD, Javitt DC, D’Angelo D, Mauro CJ, et al. Amplitude of low-frequency oscillations in schizophrenia: a resting state fMRI study. Schizophr Res. 2010;117:13–20. - PMC - PubMed

Publication types

LinkOut - more resources