[Preprint]. 2024 Jul 3:2024.07.03.601903.
doi: 10.1101/2024.07.03.601903.

Transcriptome-wide characterization of genetic perturbations

Affiliations

Transcriptome-wide characterization of genetic perturbations

Ajay Nadig et al. bioRxiv. .

Update in

Abstract

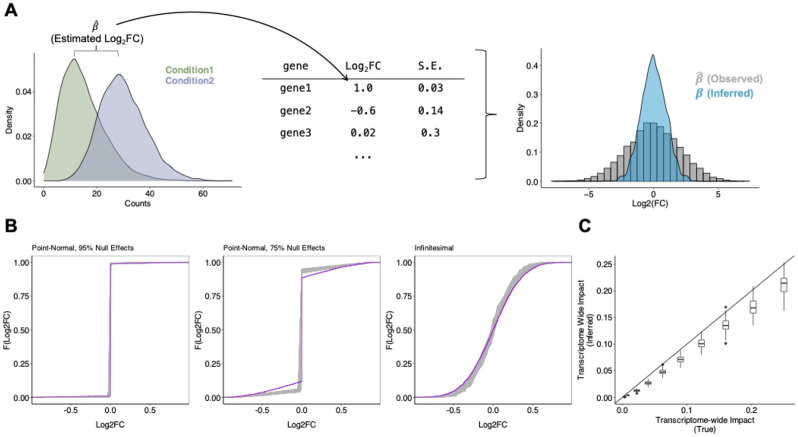
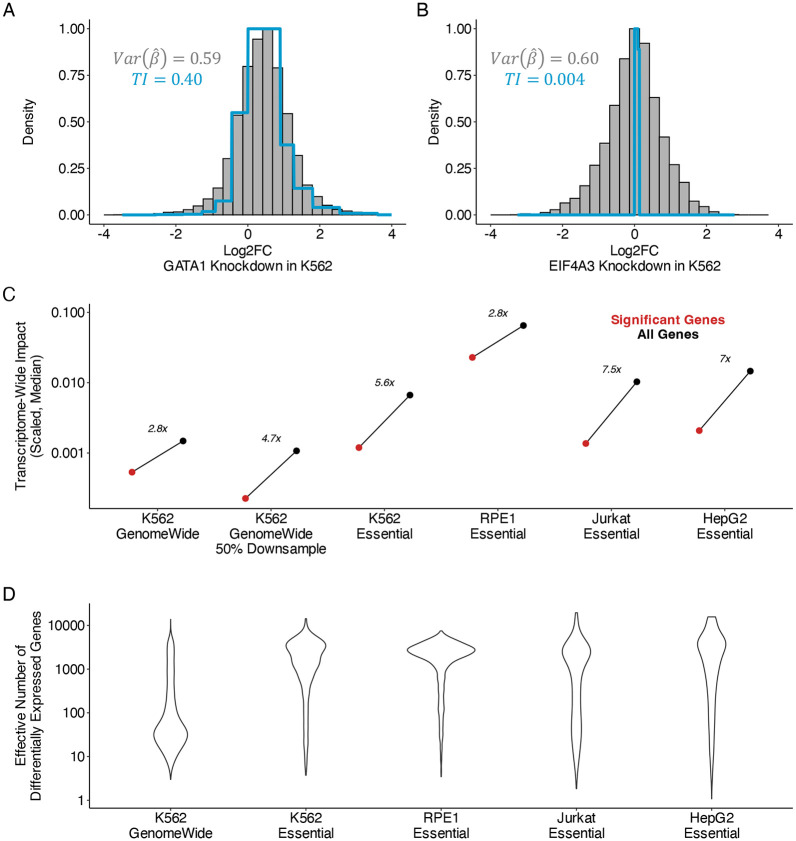
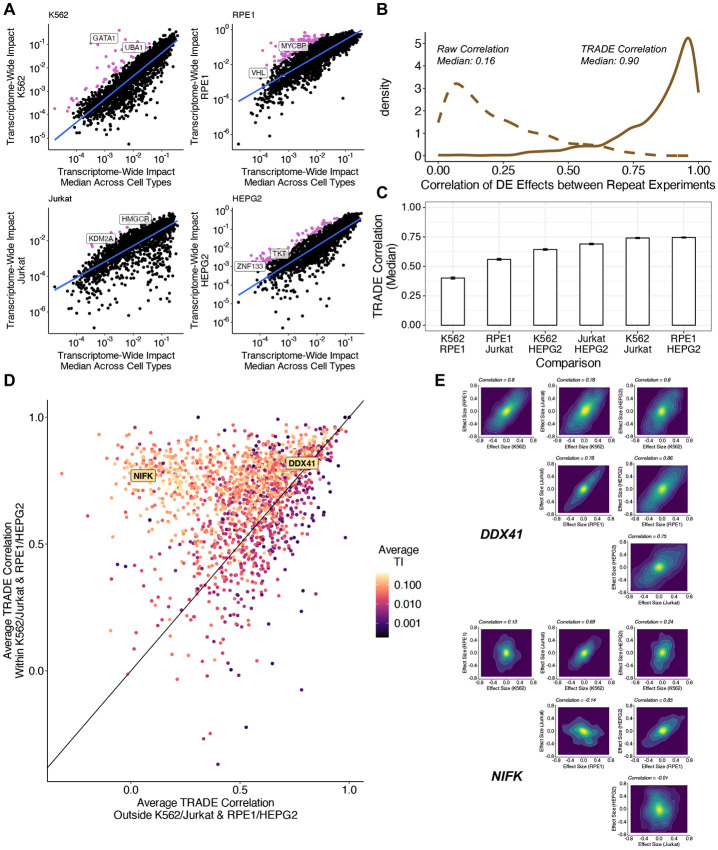
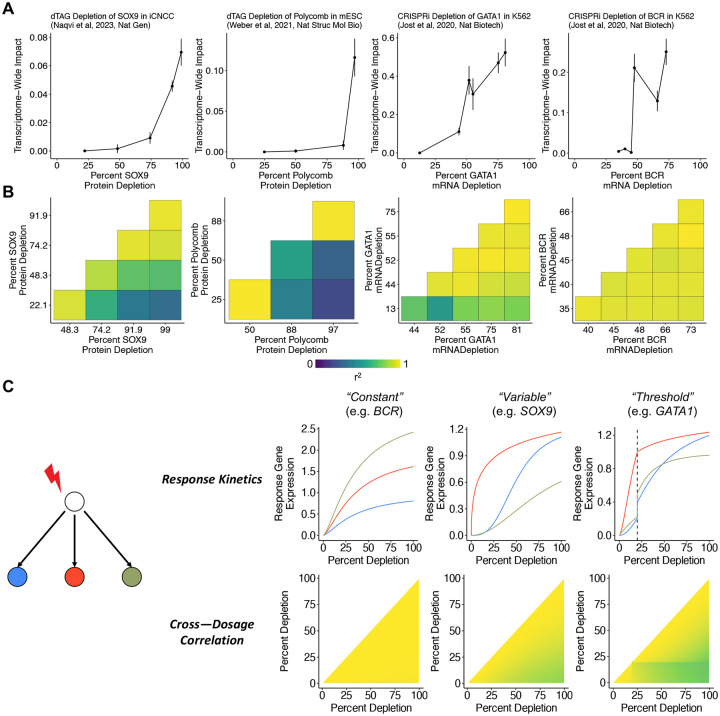
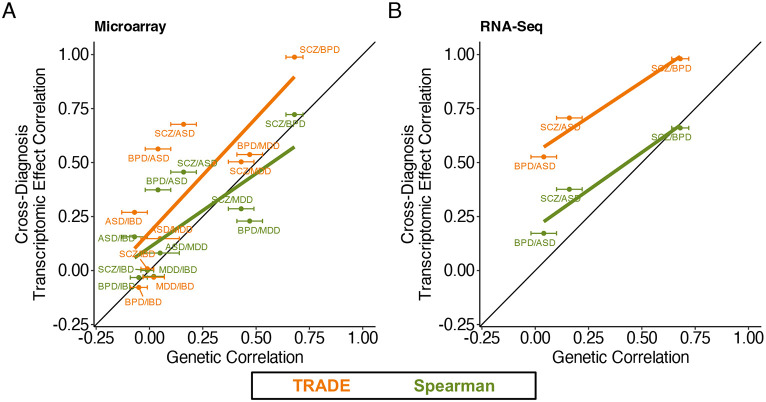
Single cell CRISPR screens such as Perturb-seq enable transcriptomic profiling of genetic perturbations at scale. However, the data produced by these screens are often noisy due to cost and technical constraints, limiting power to detect true effects with conventional differential expression analyses. Here, we introduce TRanscriptome-wide Analysis of Differential Expression (TRADE), a statistical framework which estimates the transcriptome-wide distribution of true differential expression effects from noisy gene-level measurements. Within TRADE, we derive multiple novel, interpretable statistical metrics, including the "transcriptome-wide impact", an estimator of the overall transcriptional effect of a perturbation which is stable across sampling depths. We analyze new and published large-scale Perturb-seq datasets to show that many true transcriptional effects are not statistically significant, but detectable in aggregate with TRADE. In a genome-scale Perturb-seq screen, we find that a typical gene perturbation affects an estimated 45 genes, whereas a typical essential gene perturbation affects over 500 genes. An advantage of our approach is its ability to compare the transcriptomic effects of genetic perturbations across contexts and dosages despite differences in power. We use this ability to identify perturbations with cell-type dependent effects and to find examples of perturbations where transcriptional responses are not only larger in magnitude, but also qualitatively different, as a function of dosage. Lastly, we expand our analysis to case/control comparison of gene expression for neuropsychiatric conditions, finding that transcriptomic effect correlations are greater than genetic correlations for these diagnoses. TRADE lays an analytic foundation for the systematic comparison of genetic perturbation atlases, as well as differential expression experiments more broadly.


Conflict of interest statement

Declaration of Interests J.S.W. declares outside interest in 5 AM Venture, Amgen, Chroma Medicine, KSQ Therapeutics, Maze Therapeutics, Tenaya Therapeutics, Tessera Therapeutics, Ziada Therapeutics and Third Rock Ventures. J. M. R. consults for Third Rock Ventures and Maze Therapeutics, and is a consultant for and equity holder in Waypoint Bio.

Figures

Figure 1:
Figure 1:. Transcriptome-wide Analysis of Differential Expression.
(A) Schematic for TRADE analysis, starting from condition-wise gene expression counts and ending with estimated distribution of Log2FC. (B) Estimation of various simulated effect size distributions (Point-Normal with 95% Null, Point-Normal with 75% Null, Infinitesimal/normally distributed). Purple trace shows true effect size distribution; gray traces show estimated distributions across 100 replicates. (C) Comparison of estimated and true transcriptome-wide impact in simulations.
Figure 2:
Figure 2:. Transcriptome-wide analysis of genome-wide Perturb-Seq.
(A) Examples of empirical log2FoldChange distribution and TRADE inferred distribution for perturbation of GATA1 in K562 cell line. TI = transcriptome-wide impact. (B) Similar for perturbation of EIF4A3 in K562. (C) Comparison of transcriptome-wide impact in significant and all genes in Perturb-Seq experiments. Y axis values correspond to transcriptome-wide impact estimates scaled by the number of measured genes. (D) Effective number of differentially expressed genes (πDEG) across Perturb-Seq datasets, for perturbations with nominally significant transcriptome-wide impact (Methods)
Figure 3:
Figure 3:. Transcriptome-wide analysis of genome-wide Perturb-Seq.
TRADE-derived enrichment estimates for multiple gene sets. Blue bars represent perturbation response enrichment, the enrichment of differential expression in response to perturbations. Tan bars represent perturbation impact enrichment, the enrichment of effects on other genes when genes in that gene set are perturbed.
Figure 4:
Figure 4:. Correlation of Differential Expression Across Cell Types.
(A) Transcriptome-wide impact of gene perturbations in each cell type versus the median across cell types, with outliers (pink) defined as being more than 1.64 standard deviations away from the fit line (B) Correlation of differential expression effects across replicate perturbations in K562. Dotted line represents raw correlation, solid line represents correlation estimated with TRADE. (C) Median correlation of perturbation effects for common essential genes for each pair of cell types. (D) Comparison of effect size correlation strength within similar cell types and outside of similar cell type pairs. (E) Examples of inferred joint effect size distributions across all pairs of cell types for perturbations of DDX41 and NIFK.
Figure 5:
Figure 5:. Dose-Response Relationships.
(A) Relationship between gene dosage and transcriptome-wide impact across four experiments. (B) Correlations between differential expression effects at different dosages for each experiment (C) Observations from a toy model of perturbation effects, demonstrating relationship between response kinetics consistency and resulting pattern of cross-dosage correlations.
Figure 6:
Figure 6:. Transcriptomic Correspondence of Neuropsychiatric Conditions.
Across several case/control datasets for neuropsychiatric diagnoses, estimated transcriptome-wide impact correlation (orange), compared with spearman correlations of point estimates (green). (A) Estimates for microarray datasets from PsychENCODE (B) Estimates for RNA-Seq datasets from PsychENCODE.

Similar articles

References

    1. Adamson Britt, Norman Thomas M., Jost Marco, Cho Min Y., Nuñez James K., Chen Yuwen, Villalta Jacqueline E., et al. 2016. “A Multiplexed Single-Cell CRISPR Screening Platform Enables Systematic Dissection of the Unfolded Protein Response.” Cell 167 (7): 1867–82.e21. - PMC - PubMed
    1. Binan Loïc, Danquah Serwah, Valakh Vera, Simonton Brooke, Bezney Jon, Nehme Ralda, Cleary Brian, and Farhi Samouil L.. 2023. “Simultaneous CRISPR Screening and Spatial Transcriptomics Reveals Intracellular, Intercellular, and Functional Transcriptional Circuits.” bioRxiv : The Preprint Server for Biology, December. 10.1101/2023.11.30.569494. - DOI - PMC - PubMed
    1. Binder Janos X., Pletscher-Frankild Sune, Tsafou Kalliopi, Stolte Christian, O’Donoghue Seán I., Schneider Reinhard, and Jensen Lars Juhl. 2014. “COMPARTMENTS: Unification and Visualization of Protein Subcellular Localization Evidence.” Database: The Journal of Biological Databases and Curation 2014 (February): bau012. - PMC - PubMed
    1. Bulik-Sullivan Brendan, Finucane Hilary K., Anttila Verneri, Gusev Alexander, Day Felix R., Loh Po-Ru, ReproGen Consortium, et al. 2015. “An Atlas of Genetic Correlations across Human Diseases and Traits.” Nature Genetics 47 (11): 1236–41. - PMC - PubMed
    1. Collins Ryan L., Glessner Joseph T., Porcu Eleonora, Lepamets Maarja, Brandon Rhonda, Lauricella Christopher, Han Lide, et al. 2022. “A Cross-Disorder Dosage Sensitivity Map of the Human Genome.” Cell 185 (16): 3041–55.e25. - PMC - PubMed

Publication types

LinkOut - more resources