[Preprint]. 2025 Jun 12:2024.07.02.600461.
doi: 10.1101/2024.07.02.600461.

Accounting for differences between Infinium MethylationEPIC v2 and v1 in DNA methylation-based tools

Affiliations

Accounting for differences between Infinium MethylationEPIC v2 and v1 in DNA methylation-based tools

Beryl C Zhuang et al. bioRxiv. .

Update in

  • Accounting for differences between Infinium MethylationEPIC v2 and v1 in DNA methylation-based tools.
    Zhuang BC, Jude MS, Konwar C, Yusupov N, Ryan CP, Engelbrecht HR, Whitehead J, Halberstam AA, MacIsaac JL, Dever K, Tran TK, Korinek K, Zimmer Z, Lee NR, McDade TW, Kuzawa CW, Huffman KM, Belsky DW, Binder EB, Czamara D, Korthauer K, Kobor MS. Zhuang BC, et al. Life Sci Alliance. 2025 Jul 8;8(9):e202403155. doi: 10.26508/lsa.202403155. Print 2025 Sep. Life Sci Alliance. 2025. PMID: 40628445 Free PMC article.

Abstract

The recently launched Illumina Infinium MethylationEPIC v2.0 (EPICv2), successor of MethylationEPIC v1.0 (EPICv1), retains a majority of probes in EPICv1, while expanding coverage of regulatory elements. The concordance between the two EPIC versions in DNA methylation-based tools has not yet been investigated. To address this, DNA methylation was profiled on both versions using matched blood samples across four cohorts spanning early to late adulthood. High concordance between versions at the array level but variable agreement at the individual probe level was noted. A significant contribution of EPIC version to DNA methylation variation was observed, though it was to a smaller extent compared to sample relatedness and cell type composition. Modest but significant differences in DNA methylation-based estimates between versions were observed, irrespective of the data preprocessing method used. Adjustments for EPIC version or calculation of estimates separately for each version largely mitigated these version-specific discordances. This work emphasizes the importance of accounting for EPIC version differences in research scenarios, especially in meta-analyses and longitudinal studies that require data harmonization across versions.

Keywords: DNA methylation; Epigenetics; Illumina EPIC array; cell type deconvolution; epigenetic clocks; inflammation and lifestyle biomarkers.


Conflict of interest statement

Conflict of interest D.W.B. is listed as an inventor of the Duke University and University of Otago invention DunedinPACE, which is licensed to TruDiagnostic. The other authors declare that they have no competing interests.

Figures

Figure 1.
Figure 1.
Overview of study design and analyses. *Array level correlations and hierarchical clustering were also performed by combining cohorts.
Figure 2.
Figure 2.
(A) Unsupervised hierarchical clustering using complete linkage with Euclidean distance on sample-to-sample Pearson correlations, calculated using the 721,378 probes shared between EPICv1 and EPICv2 with functional normalized data across all four cohorts; blue to red color range denotes Pearson correlation from 0.95–1.00. (B) Cohort-wise unsupervised hierarchical clustering on sample-to-sample Pearson correlations. (C) Cohort-wise principal component analysis (PCA). Accounted variance of PCs are shown in brackets in the x- and y-axis label. Grey lines indicate matched samples from the same donor profiled on both EPICv1 and EPICv2. (D). Probe-level Spearman correlation and pooled standard deviation (SD) of common probes. The X-axis represents the Spearman correlation and Y-axis represents the pooled SD of probes common to both EPIC versions. Dashed horizontal line indicates the pooled SD threshold set at lower quartile pooled SD for each cohort, and the vertical dashed line indicates the correlation threshold set at 0.70. The colors indicate the density of points, such that pink is low density and yellow is high density. Probes unique to either version are not shown.
Figure 3.
Figure 3.
Differences in DNA methylation-based immune cell type proportions estimated using the IDOL reference on matched samples assessed on EPICv1 and EPICv2 in VHAS, CLHNS, and CALERIE. Paired t-tests were performed to compare cell type proportions between EPICv1 and EPICv2, and p-values were derived. Statistical significance was defined as Bonferroni adjusted p-value <0.05. ** denotes Bonferroni p <0.05, *** denotes Bonferroni p <0.001, “ns” denotes “not significant”, and “d” denotes effect size measured using Cohen’s d. A positive Cohen’s d indicates higher estimates in EPICv2 compared to EPICv1.
Figure 4.
Figure 4.
Differences in epigenetic ages between EPICv1 and EPICv2 using the Horvath pan-tissue, Hannum, Horvath skin and blood, PhenoAge, and GrimAge clocks in VHAS, CLHNS, and CALERIE when using (A) functional normalization and (B) functional normalization with batch-correction for EPIC version, chip and row. Paired t-tests were performed to compare estimates between EPICv1 and EPICv2, and p-values were derived. Statistical significance was defined as Bonferroni adjusted p-value <0.05. ** denotes Bonferroni p <0.05, *** denotes Bonferroni p<0.001, “ns” denotes “not significant”, and “d” denotes effect size measured using Cohen’s d. A positive Cohen’s d indicates estimates in EPICv2 compared to EPICv1.
Figure 5.
Figure 5.
Epigenetic ages on matched samples assessed on EPICv1 and EPICv2 in VHAS. (A) Scatter plot of Horvath pan-tissue, Hannum, Horvath skin and blood, PhenoAge, and GrimAge clock ages (Y axis) and chronological age (X axis) with dotted line indicating x=y, coloured by EPIC version. (B-C) Boxplots comparing EPICv1 and EPICv2 EAAs calculated by considering (B) EPIC versions separately and (C) combined. Paired t-tests were performed to compare estimates between EPICv1 and EPICv2, and p-values were derived. Statistical significance was defined as Bonferroni adjusted p-value <0.05. ** denotes Bonferroni p <0.05, *** denotes Bonferroni p <0.001, “ns” denotes “not significant”, and “d” denotes effect size measured using Cohen’s d. A positive Cohen’s d indicates higher estimates in EPICv2 compared to EPICv1.
Figure 6.
Figure 6.
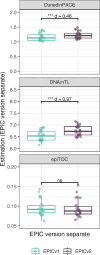
Rate-based and other clock estimates on matched samples assessed on EPICv1 and EPICv2 in VHAS. Boxplots comparing DunedinPACE, DNAmTL and epiTOC estimates calculated by considering EPIC versions separately between EPICv1 and EPICv2. Paired t-tests were performed to compare estimates between EPICv1 and EPICv2, and p-values were derived. Statistical significance was defined as Bonferroni adjusted p-value <0.05. ** denotes Bonferroni p <0.05, *** denotes Bonferroni p <0.001, “ns” denotes “not significant”, and “d” denotes effect size measured using Cohen’s d. A positive Cohen’s d indicates estimates in EPICv2 compared to EPICv1.

Similar articles

References

    1. Adair LS, Popkin BM, Akin JS, Guilkey DK, Gultiano S, Borja J, Perez L, Kuzawa CW, McDade T, Hindin MJ. 2011. Cohort Profile: The Cebu Longitudinal Health and Nutrition Survey. Int J Epidemiol 40: 619–625. - PMC - PubMed
    1. Battram T, Yousefi P, Crawford G, Prince C, Sheikhali Babaei M, Sharp G, Hatcher C, Vega-Salas MJ, Khodabakhsh S, Whitehurst O, et al. 2022. The EWAS Catalog: a database of epigenome-wide association studies. Wellcome Open Res 7: 41. - PMC - PubMed
    1. Belsky DW, Caspi A, Corcoran DL, Sugden K, Poulton R, Arseneault L, Baccarelli A, Chamarti K, Gao X, Hannon E, et al. 2022. DunedinPACE, a DNA methylation biomarker of the pace of aging eds. Deelen J., Tyler J.K., Suderman M., and Deelen J.. eLife 11: e73420. - PMC - PubMed
    1. Bergstedt J, Azzou SAK, Tsuo K, Jaquaniello A, Urrutia A, Rotival M, Lin DTS, MacIsaac JL, Kobor MS, Albert ML, et al. 2022. The immune factors driving DNA methylation variation in human blood. Nat Commun 13: 5895. - PMC - PubMed
    1. Bishara AJ, Hittner JB. 2015. Reducing Bias and Error in the Correlation Coefficient Due to Nonnormality. Educ Psychol Meas 75: 785–804. - PMC - PubMed

Publication types

LinkOut - more resources