[Preprint]. 2024 Jul 4:2024.07.02.601748.
doi: 10.1101/2024.07.02.601748.

Epigenetic changes regulating the epithelial-mesenchymal transition in human trophoblast differentiation

Affiliations

Epigenetic changes regulating the epithelial-mesenchymal transition in human trophoblast differentiation

William E Ackerman 4th et al. bioRxiv. .

Update in

Abstract

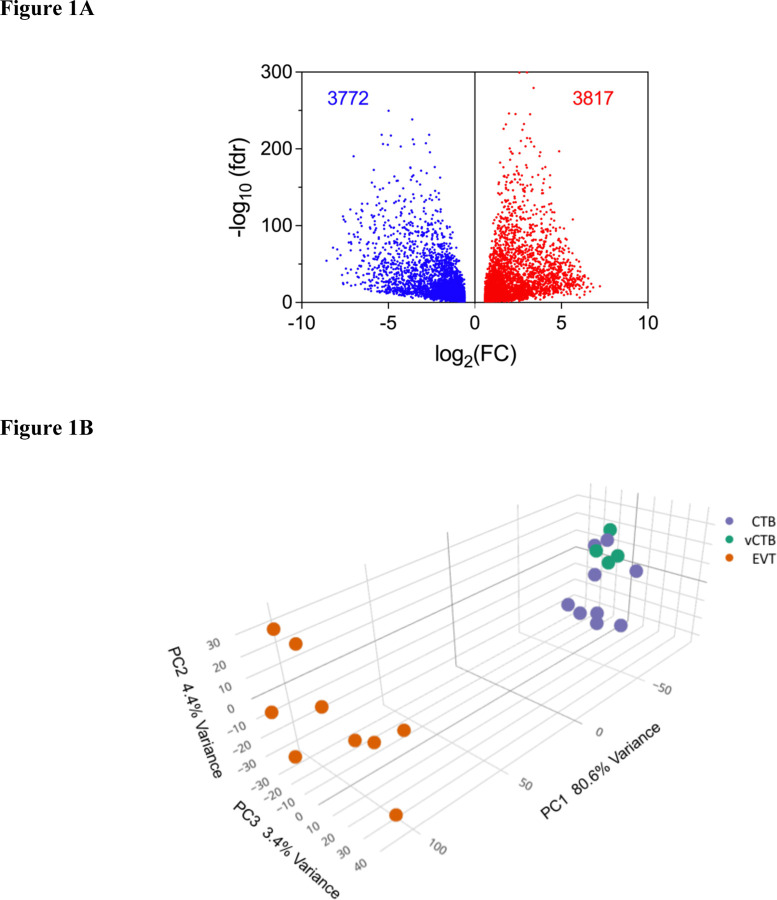
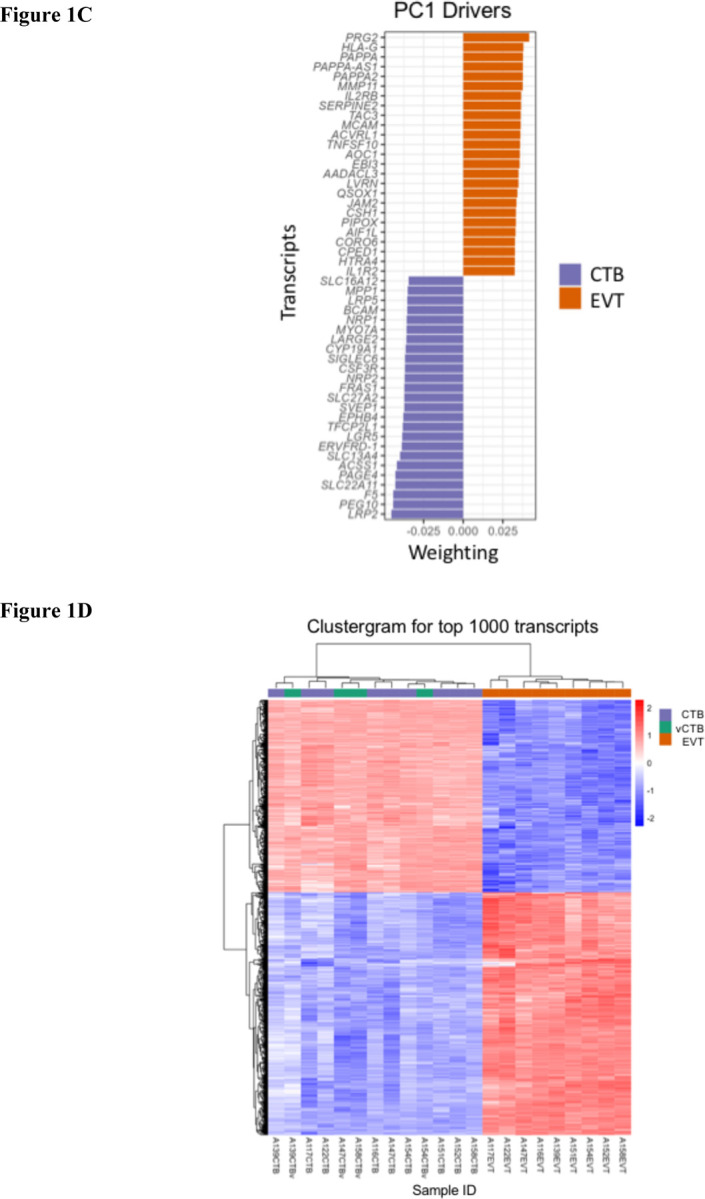
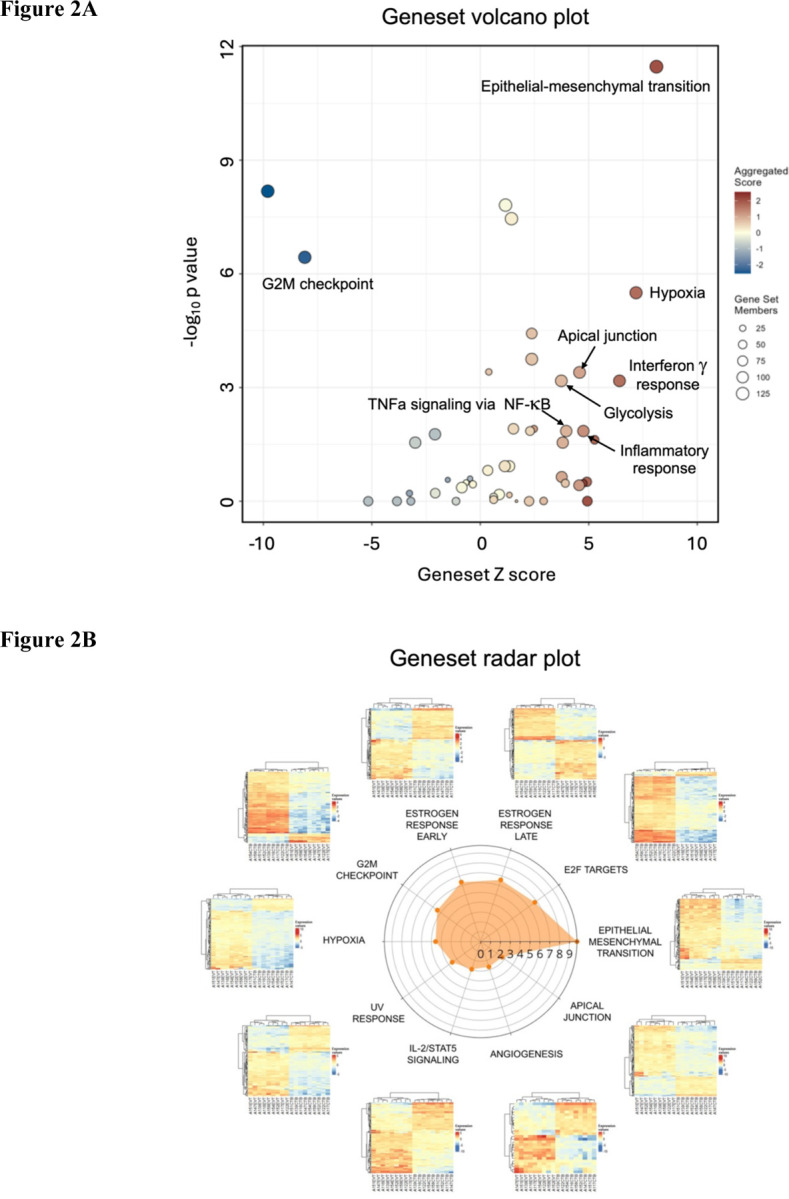
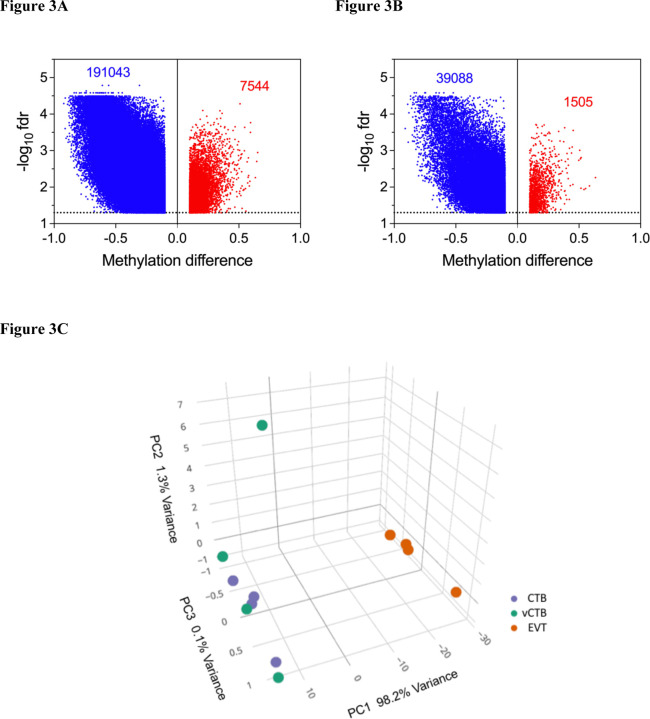
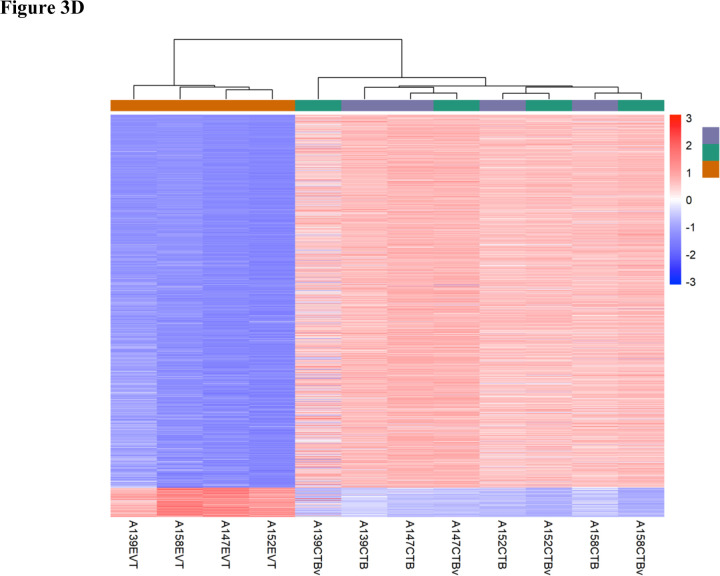
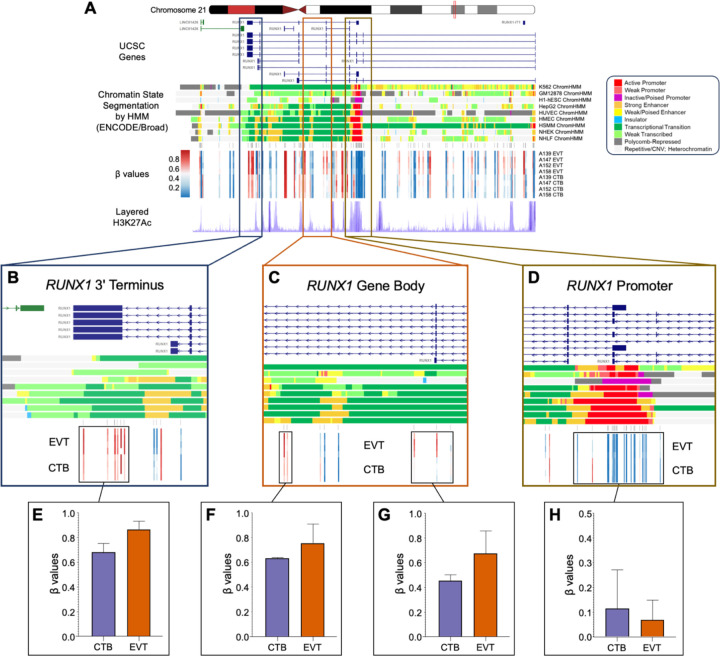
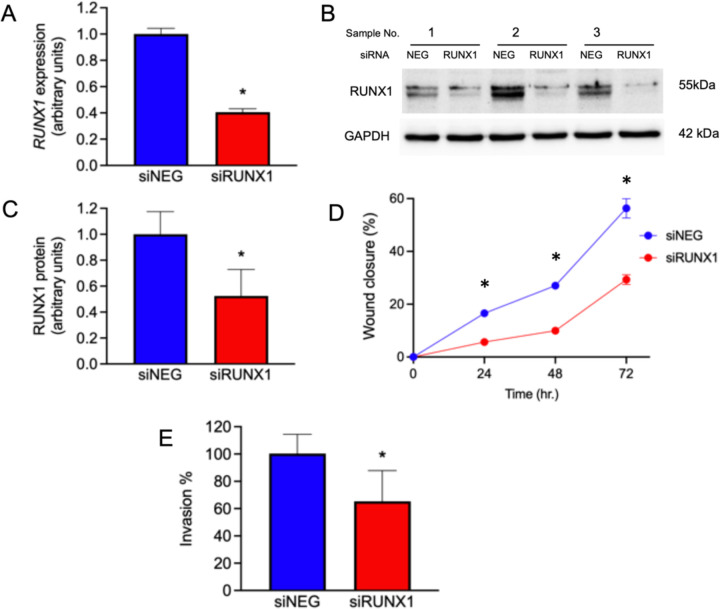
The phenotype of human placental extravillous trophoblast (EVT) at the end of pregnancy reflects both first trimester differentiation from villous cytotrophoblast (CTB) and later gestational changes, including loss of proliferative and invasive capacity. Invasion abnormalities are central to two major placental pathologies, preeclampsia and placenta accreta spectrum, so characterization of the corresponding normal processes is crucial. In this report, our gene expression analysis, using purified human CTB and EVT cells, highlights an epithelial-mesenchymal transition (EMT) mechanism underlying CTB-EVT differentiation and provides a trophoblast-specific EMT signature. In parallel, DNA methylation profiling shows that CTB cells, already hypomethylated relative to non-trophoblast cell lineages, show further genome-wide hypomethylation in the transition to EVT. However, a small subgroup of genes undergoes gains of methylation (GOM) in their regulatory regions or gene bodies, associated with differential mRNA expression (DE). Prominent in this GOM-DE group are genes involved in the EMT, including multiple canonical EMT markers and the EMT-linked transcription factor RUNX1, for which we demonstrate a functional role in modulating the migratory and invasive capacities of JEG3 trophoblast cells. This analysis of DE associated with locus-specific GOM, together with functional studies of an important GOM-DE gene, highlights epigenetically regulated genes and pathways acting in human EVT differentiation and invasion, with implications for obstetric disorders in which these processes are dysregulated.

Keywords: Trophoblast; differentiation; epithelial-mesenchymal transition; methylation.


Conflict of interest statement

Competing interests All authors assert that they have no competing interests to declare

Figures

Figure 1:
Figure 1:. Characteristics of the differentially expressed genes in EVT compared to CTB.
(A) Volcano plot of RNA-sequencing DE data showing decreased expression (blue) and increased expression (red). Paired analysis, using the threshold parameters of (1) FDR ≤ 0.05, (2) featureCount (baseMean) ≥ 10, (3) a fold change of ≥ 1.5. (B) PCA plot of CTB (purple), vCTB (green) and EVT (orange) using the fullDE geneset. (C) Top 50 driver genes (25 positive, 25 negative) for the first component of the PCA. (D) Clustergram for CTB (purple), vCTB (green) and EVT (orange) for the top 1000 genes.
Figure 2:
Figure 2:. Functional enrichment of differentially expressed genes in EVT compared to CTB.
(A) Volcano/bubble plot of enrichment drawn from the Hallmark database of genesets. (B) Radar plot of the top 10 enriched genesets.
Figure 3:
Figure 3:. Differential methylation of genes in EVT compared to CTB.
(A) Volcano plot showing differences in total methylation (decreased – blue, increased – red) between CTB and EVT. (B) Volcano plot showing differences in promoter methylation (decreased – blue, increased – red) between CTB and EVT. (C) PCA plot of the methylome for CTB (purple), vCTB (green) and EVT (orange). (D) Clustergram showing differences in methylation between CTB, vCTB and EVT
Figure 4:
Figure 4:. Regional RUNX1 gene body hypermethylation in EVTs relative to CTBs.
(A) Integrative genomics viewer (IGV) visualization of the genomic region around RUNX1 (Chr21: 36,110,847–36,448,197; hg19 coordinates) displaying the chromosome 21 ideogram and the following tracks: (1) UCSC known genes track showing RUNX1 transcripts (blue) and antisense LINC01426 transcripts (green); (2) Chromatin State Segmentation by Hidden Markov Model (ChromHMM) track for 9 ENCODE cell lines; (3) Illumina 850k EPIC methylation array track showing positions of CpG sites being measured; (4) heatmap representation of DNA methylation (β values) for EVT and CTB samples; (5) layered H3K27Ac track (epigenetic mark for active regulatory elements). (B-D) Enlarged views of three regions from the RUNX1 gene (3’ terminus, gene body, 5’ promoter) showing DNA methylation changes in relation to genomic and epigenomic features. (E-H) Bar graphs (mean ± SD) summarizing β values for select regions (boxes). The ChromHMM display conventions are as in https://genome.ucsc.edu/cgi-bin/hgTrackUi?g=wgEncodeBroadHmm.
Figure 5:
Figure 5:. Role of RUNX1 in trophoblast.
(A) RUNX1 gene expression in JEG3 cells following treatment with siNEG or siRUNX1 (normalized to YWHAZ, n=4, * p < 0.05). (B) Western blot of JEG3 cells for RUNX1 and GAPDH following treatment with siNEG or siRUNX1. (C) Quantification of RUNX1 protein expression (normalized to GAPDH, n=3, * p < 0.05). (D) Cellular migration following treatment with siRUNX1, measured as a percentage of wound closure; n= 3; * p < 0.05. (E) Invasion of siNEG- or siRUNX1-treated JEG3 through Matrigel-coated Transwell membranes, measured as a percentage; n=16; * p < 0.001

References

    1. Anders S., Pyl P. T. and Huber W. (2015). HTSeq--a Python framework to work with high-throughput sequencing data. Bioinformatics 31, 166–169. 10.1093/bioinformatics/btu638 - DOI - PMC - PubMed
    1. Anton L., Brown A. G., Bartolomei M. S. and Elovitz M. A. (2014). Differential methylation of genes associated with cell adhesion in preeclamptic placentas. PLoS ONE [Electronic Resource] 9, e100148. - PMC - PubMed
    1. Bermudez L. G., Madariaga I., Zuniga M. I., Olaya M., Canas A., Rodriguez L. S., Moreno O. M. and Rojas A. (2021). RUNX1 gene expression changes in the placentas of women smokers. Exp Ther Med 22, 902. 10.3892/etm.2021.10334 - DOI - PMC - PubMed
    1. Chatterjee A., Macaulay E. C., Rodger E. J., Stockwell P. A., Parry M. F., Roberts H. E., Slatter T. L., Hung N. A., Devenish C. J. and Morison I. M. (2016). Placental Hypomethylation Is More Pronounced in Genomic Loci Devoid of Retroelements. G3 (Bethesda) 6, 1911–1921. 10.1534/g3.116.030379 - DOI - PMC - PubMed
    1. Chen Y., Wang K., Qian C. N. and Leach R. (2013). DNA methylation is associated with transcription of Snail and Slug genes. Biochem Biophys Res Commun 430, 1083–1090. 10.1016/j.bbrc.2012.12.034 - DOI - PMC - PubMed

Publication types