

This is a preprint.
Self-organizing recruitment of compensatory areas maximizes residual motor performance post-stroke
- PMID: 39005333
- PMCID: PMC11244868
- DOI: 10.1101/2024.06.28.601213
Self-organizing recruitment of compensatory areas maximizes residual motor performance post-stroke
Abstract
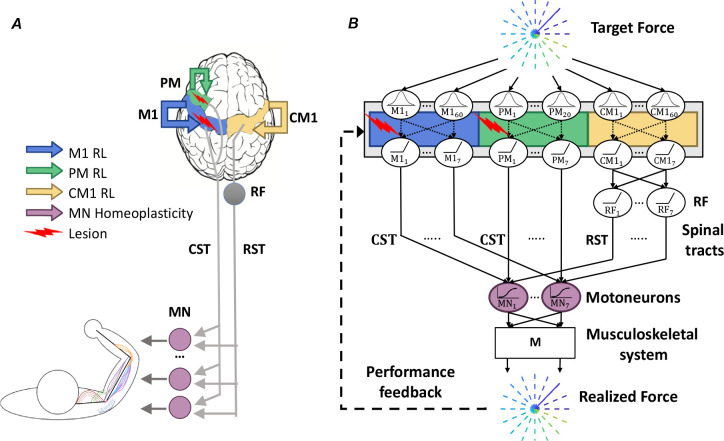
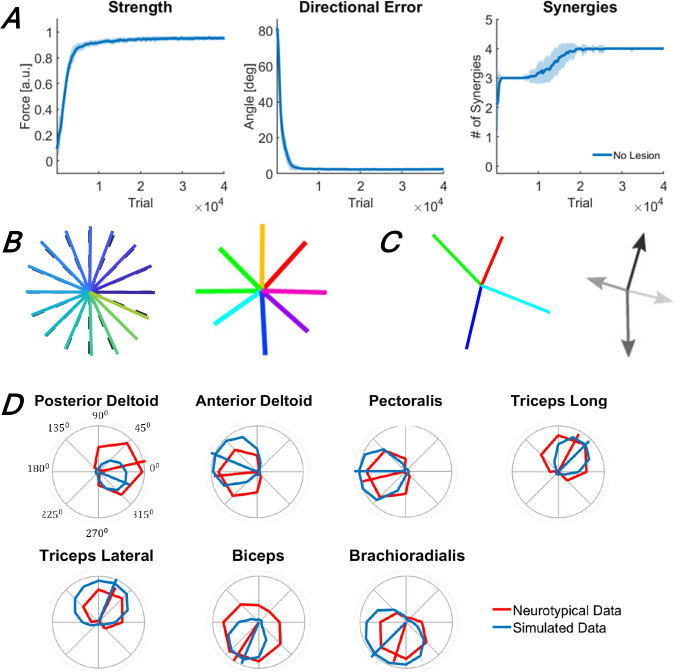
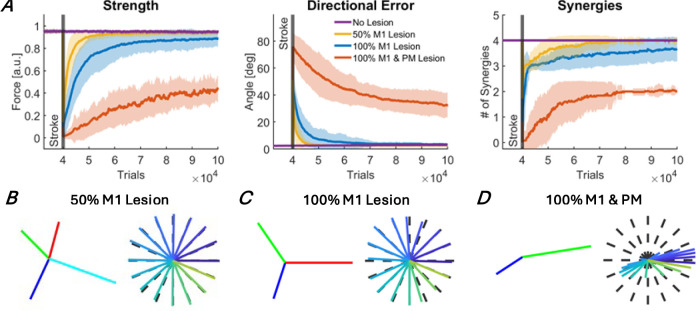
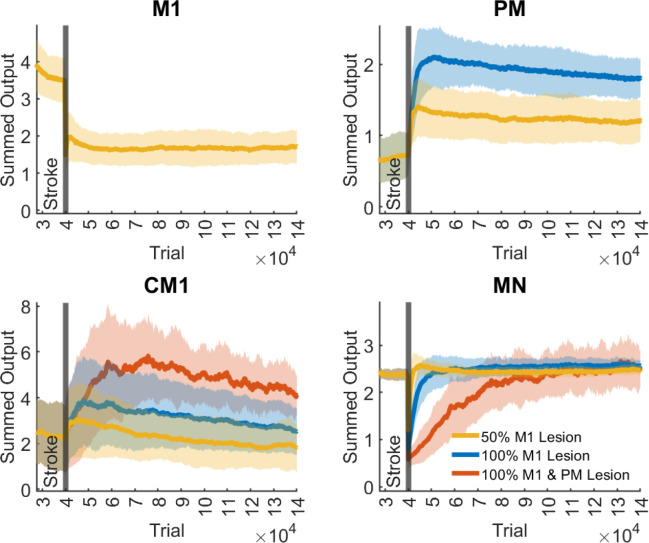
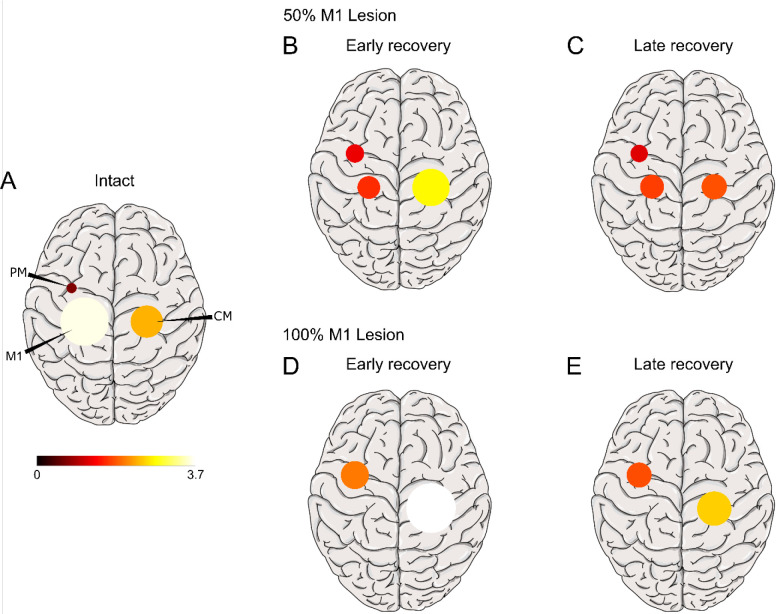
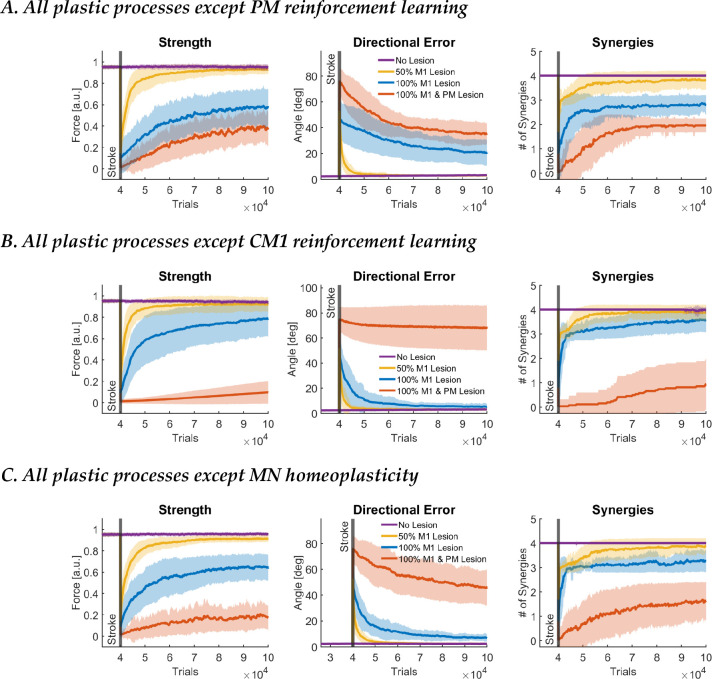
Whereas the orderly recruitment of compensatory motor cortical areas after stroke depends on the size of the motor cortex lesion affecting arm and hand movements, the mechanisms underlying this reorganization are unknown. Here, we hypothesized that the recruitment of compensatory areas results from the motor system's goal to optimize performance given the anatomical constraints before and after the lesion. This optimization is achieved through two complementary plastic processes: a homeostatic regulation process, which maximizes information transfer in sensory-motor networks, and a reinforcement learning process, which minimizes movement error and effort. To test this hypothesis, we developed a neuro-musculoskeletal model that controls a 7-muscle planar arm via a cortical network that includes a primary motor cortex and a premotor cortex that directly project to spinal motor neurons, and a contra-lesional primary motor cortex that projects to spinal motor neurons via the reticular formation. Synapses in the cortical areas are updated via reinforcement learning and the activity of spinal motor neurons is adjusted through homeostatic regulation. The model replicated neural, muscular, and behavioral outcomes in both non-lesioned and lesioned brains. With increasing lesion sizes, the model demonstrated systematic recruitment of the remaining primary motor cortex, premotor cortex, and contra-lesional cortex. The premotor cortex acted as a reserve area for fine motor control recovery, while the contra-lesional cortex helped avoid paralysis at the cost of poor joint control. Plasticity in spinal motor neurons enabled force generation after large cortical lesions despite weak corticospinal inputs. Compensatory activity in the premotor and contra-lesional motor cortex was more prominent in the early recovery period, gradually decreasing as the network minimized effort. Thus, the orderly recruitment of compensatory areas following strokes of varying sizes results from biologically plausible local plastic processes that maximize performance, whether the brain is intact or lesioned.
Figures
Similar articles
-
Integrated technology for evaluation of brain function and neural plasticity.Phys Med Rehabil Clin N Am. 2004 Feb;15(1):263-306. doi: 10.1016/s1047-9651(03)00124-4. Phys Med Rehabil Clin N Am. 2004. PMID: 15029909 Review.
-
Cell based therapy enhances activation of ventral premotor cortex to improve recovery following primary motor cortex injury.Exp Neurol. 2018 Jul;305:13-25. doi: 10.1016/j.expneurol.2018.03.010. Epub 2018 Mar 11. Exp Neurol. 2018. PMID: 29540323 Free PMC article.
-
The origin of corticospinal projections from the premotor areas in the frontal lobe.J Neurosci. 1991 Mar;11(3):667-89. doi: 10.1523/JNEUROSCI.11-03-00667.1991. J Neurosci. 1991. PMID: 1705965 Free PMC article.
-
Premotor Cortical-Cerebellar Reorganization in a Macaque Model of Primary Motor Cortical Lesion and Recovery.J Neurosci. 2019 Oct 23;39(43):8484-8496. doi: 10.1523/JNEUROSCI.0077-19.2019. Epub 2019 Oct 3. J Neurosci. 2019. PMID: 31582526 Free PMC article.
-
Functional recovery following motor cortex lesions in non-human primates: experimental implications for human stroke patients.J Integr Neurosci. 2011 Sep;10(3):353-84. doi: 10.1142/S0219635211002737. J Integr Neurosci. 2011. PMID: 21960307 Free PMC article. Review.
References
-
- Alstermark B., Isa T., Pettersson L. G. and Sasaki S. (2007). “The C3-C4 propriospinal system in the cat and monkey: a spinal pre-motoneuronal centre for voluntary motor control.” Acta Physiol (Oxf) 189(2): 123–140. - PubMed
-
- Barto A. G. (2002). Reinforcement learning in motor control. Handbook of brain theory and neural networks. 2: 968–972.
-
- Beauparlant J., van den Brand R., Barraud Q., Friedli L., Musienko P., Dietz V. and Courtine G. (2013). “Undirected compensatory plasticity contributes to neuronal dysfunction after severe spinal cord injury.” Brain 136(Pt 11): 3347–3361. - PubMed
Publication types
Grants and funding
LinkOut - more resources
Full Text Sources