[Preprint]. 2024 Jul 5:2024.07.03.601937.
doi: 10.1101/2024.07.03.601937.

Deciphering the cis-regulatory landscape of natural yeast Transcript Leaders

Affiliations

Deciphering the cis-regulatory landscape of natural yeast Transcript Leaders

Christina Akirtava et al. bioRxiv. .

Update in

Abstract

Protein synthesis is a vital process that is highly regulated at the initiation step of translation. Eukaryotic 5' transcript leaders (TLs) contain a variety of cis-regulatory features that influence translation and mRNA stability. However, the relative influences of these features in natural TLs are poorly characterized. To address this, we used massively parallel reporter assays (MPRAs) to quantify RNA levels, ribosome loading, and protein levels from 11,027 natural yeast TLs in vivo and systematically compared the relative impacts of their sequence features on gene expression. We found that yeast TLs influence gene expression over two orders of magnitude. While a leaky scanning model using Kozak contexts and uAUGs explained half of the variance in expression across transcript leaders, the addition of other features explained ~70% of gene expression variation. Our analyses detected key cis-acting sequence features, quantified their effects in vivo, and compared their roles to motifs reported from an in vitro study of ribosome recruitment. In addition, our work quantitated the effects of alternative transcription start site usage on gene expression in yeast. Thus, our study provides new quantitative insights into the roles of TL cis-acting sequences in regulating gene expression.


Figures

Figure 1.
Figure 1.. MPRA analysis of transcript leader influence on protein and RNA levels.
(A) FACS-Seq - a library of thousands of native yeast 5’ TLs, including alternative transcription start sites was cloned upstream of a single-copy YFP dual fluorescence reporter plasmid containing mCherry as an internal control. The reporter plasmids were transformed into S. cerevisiae. Targeted RNA-seq was used to assay RNA levels, relative to plasmid levels (RNArpkm/DNArpkm) (B) Cells were sorted and binned via FACS. Plasmids were extracted and sequenced to assay YFP expression levels for each reporter. (C) The YFP distribution for the 5’ TL library (mean=0.713, median=0.842). (D) Average RNA level across 3 replicates of transcripts for different 5’ TL groups (all, no uAUG, uAUG). n=9382, 7923, 1459 (E) RNA levels for different YFP level groups. Outlier RNA-levels above 10 not shown. n = 1255, 745, 765, 1769, 6477. (F) STREME motifs identified in the Top and Bottom 20% of RNA levels with and without uAUGs. (P-values) *** < 0.001, ** < 0.01, * < 0.05
Figure 2.
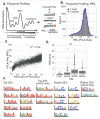
Figure 2.. PoLib-Seq MPRA determines relative ribosome loading driven by natural yeast transcript leaders.
(A) The schematic depicts the PoLib-Seq assay used to measure the ribosome loading on 5’ TLs. Polysome extracts were prepared from WT yeast strain (BY4741). The extracts were fractionated on a 7% to 47% sucrose gradient via ultracentrifugation. UV absorbance graph represents polysome fractions from non-translating (40S, 60S, 80S) to translating (2 polysomes +). RNA extracted from Polysome fractions was prepared for sequencing (methods). Relative ribosome load (RRL) was calculated as translated/total for each TL. (B) Distribution of PoLib-Seq measurements of RRL for 5’ TLs. (C) FACS-Seq vs PoLib-Seq: Comparison of YFP/mCherry (x-axis) from FACS-Seq and RRL from PoLib-Seq (y-axis) results for the 5’ TL library. The measurements are highly correlated with R2 of 0.736. (D) Mean RNA levels for different RRL level groups for all TLs. n = 234, 1396, 7329, 423. All p-values < 0.001 F) STREME motifs identified in the Top and Bottom 20% of RRL levels with and without uAUGs. (P-values) *** < 0.001, ** < 0.01, * < 0.05
Figure 3.
Figure 3.. Impacts of natural yeast transcript leader RNA structure on gene expression in vivo
(A) Schematic displaying different mRNA structures: cap structure, start codon structure, g-quartets, g-quadruplexes. (B) Boxplots showing the relationship between cap structure (ΔG) and YFP levels. n = 4279, 3091, 1338, 248, 32 (no uAUG TLs included) (C) Boxplots representing the association between YFP levels and the unfolding energy of structures surrounding the main start codon (ΔΔG). n = 498, 5832, 2368, 266, 24 (no uAUG TLs included) (D) (left) G-quartet structures form when 4 Guanines (in a row) are Hydrogen bonded to each other. From the TL dataset, we saw G-quartets lead to decreased initiation. n = 8753, 292, 13 (no uAUG TLs included) (right) In the presence of metal ions, these G-quarters can stack on top of each other to form higher-order structures known as g-quadruplexes. The boxplots show a decrease in YFP expression in the presence of g-quadruplexes n= 8950, 107 (no uAUG TLs included). Only 1 gene (YBR196C-A) was predicted to contain 2 g-quadruplexes (not shown). (A-C) (P-values) *** < 0.001, ** < 0.01, * < 0.05
Figure 4.
Figure 4.. A simple leaky scanning model explains half of the variance of gene expression from natural yeast TLs.
(A) Schematic describing a simple leaky scanning model. (Top) mRNA containing two AUG start codons. (Middle) The Main Codon Model (MCM) predicts YFP expression using the Kozak strength for the main CDS start codon. (Bottom) The Leaky Scanning Model (LSM) predicts YFP expression using the Kozak strengths of all AUGs. This example shows the ribosome skipping the first AUG and initiating at the second ORF (black). The probability of initiating at YFP is given by the fraction of ribosomes that reach the CDS start codon (Pskip) times the Kozak strength at the YFP start codon (Pinit2). (B) The MCM explains 21.6% of the variance in YFP levels for TLs without any upstream AUGs (R2 = 0.216; see Fig SX for uORF TLs). (C) Boxplots representing the distribution of measured YFP expression (y-axis) for native 5’ TLs binned by the number of uORFs (x-axis). Additional uAUGs further repress YFP expression. (P-values) *** < 0.001, ** < 0.01, * < 0.05. uAUGs:n = 0:9058, 1:1448, 2:309, 3:126, 4:50, 5:22, 6:10, 7:4 (D) Linear regression model of measured YFP (y-axis) versus the LSM predicted Kozak strength (x-axis) for each 5’ TL.
Figure 5.
Figure 5.. Elastic net regression determines the relative influence of transcript leader features on gene expression in vivo
(A) Elastic Net Model (EN) for predicting YFP expression. The scatter plot shows the measured YFP expression (y-axis) for all 5’ TLs versus the EN model predictions of YFP (x-axis) in WT yeast. The resulting model explains ~70% of variance in experimental YFP. When the predictions are capped at 1, the resulting R2 drops to ~0.69 (B) The table shows model coefficients for the significant features extracted from the EN model after n=100 iterations (additional features shown in supplemental data). (C) Schematic of 5’ TL features predicted to influence YFP expression based on the EN model.
Figure 6.
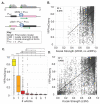
Figure 6.. Effects of natural yeast alternative transcription start sites (aTSSs) on protein expression in vivo.
(A) Scatter plot compares the log fold change (log2(Long/Short)) of 5’ TLs for genes with alternative TSSs (x-axis=length; y-axis=log2change; R2=0.153). Typically, longer TLs displayed greater changes in YFP levels. The negative log2YFP values (blue) indicate that the longer TL was less efficient at translation compared to its shorter counterpart. A positive log2YFP (yellow) values reveal that the shorter TL had lower YFP levels. The red dashed lines represent the median for positive (0.139) and negative (−0.411) values. Red symbols identify genes represented in FIG 2B. (B) Examples of alternative transcript leaders that significantly changed YFP expression. (B) YLR265C (S. paradoxus) and YER151C (S. cerevisiae) both had longer transcripts that increased YFP levels. (C) YOL140W (S. cerevisiae) and YER101C (S. paradoxus) were two examples of longer transcript leaders which repressed YFP expression with additions of uAUGs. R2 = 0.57.

Similar articles

References

    1. Hinnebusch A.G., Ivanov I.P. and Sonenberg N. (2016) Translational control by 5’-untranslated regions of eukaryotic mRNAs. Science, 352, 1413–1416. - PMC - PubMed
    1. Kozak M. (1988) Leader length and secondary structure modulate mRNA function under conditions of stress. Mol. Cell. Biol., 8, 2737–2744. - PMC - PubMed
    1. Cigan A.M., Pabich E.K. and Donahue T.F. (1988) Mutational analysis of the HIS4 translational initiator region in Saccharomyces cerevisiae. Mol. Cell. Biol., 8, 2964–2975. - PMC - PubMed
    1. Kozak M. (1989) The scanning model for translation: an update. J. Cell Biol., 108, 229–241. - PMC - PubMed
    1. Arribere J.A. and Gilbert W.V. (2013) Roles for transcript leaders in translation and mRNA decay revealed by transcript leader sequencing. Genome Res., 23, 977–987. - PMC - PubMed

Publication types

LinkOut - more resources