[Preprint]. 2024 Jul 3:2024.07.01.601612.
doi: 10.1101/2024.07.01.601612.

Microglia Morphological Response to Mesenchymal Stromal Cell Extracellular Vesicles Demonstrates EV Therapeutic Potential for Modulating Neuroinflammation

Affiliations

Microglia Morphological Response to Mesenchymal Stromal Cell Extracellular Vesicles Demonstrates EV Therapeutic Potential for Modulating Neuroinflammation

Kanupriya R Daga et al. bioRxiv. .

Update in

Abstract

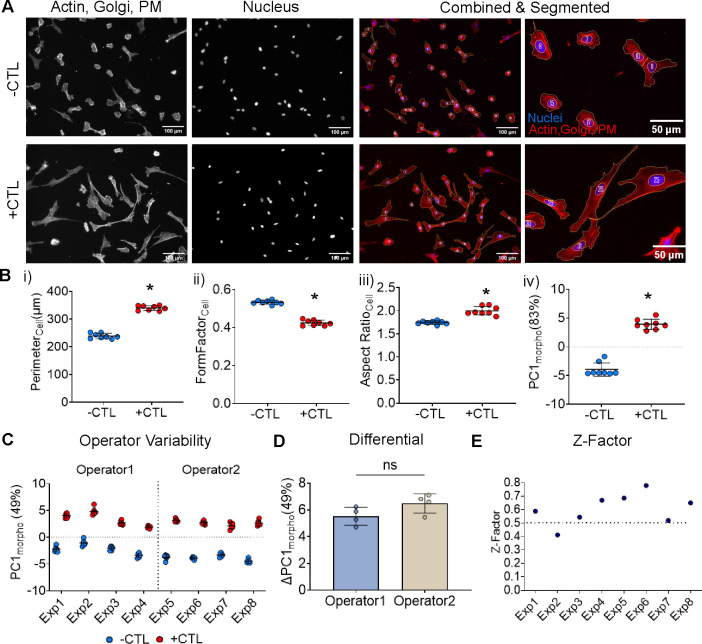
Background: Mesenchymal stromal cell derived extracellular vesicles (MSC-EVs) are a promising therapeutic for neuroinflammation. MSC-EVs can interact with microglia, the resident immune cells of the brain, to exert their immunomodulatory effects. In response to inflammatory cues, such as cytokines, microglia undergo phenotypic changes indicative of their function e.g. morphology and secretion. However, these changes in response to MSC-EVs are not well understood. Additionally, no disease-relevant screening tools to assess MSC-EV bioactivity exist, which has further impeded clinical translation. Here, we developed a quantitative, high throughput morphological profiling approach to assess the response of microglia to neuroinflammation-relevant signals and whether this morphological response can be used to indicate the bioactivity of MSC-EVs.

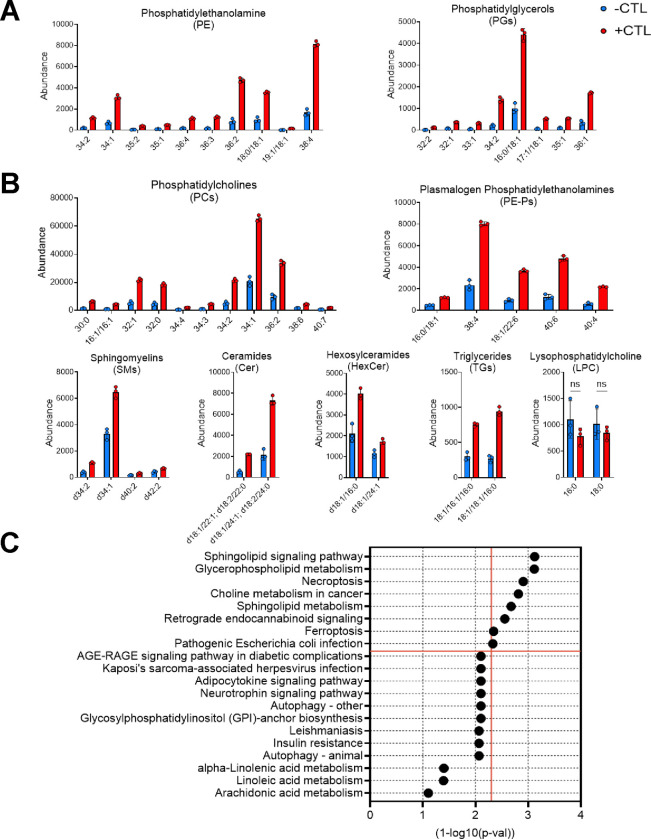
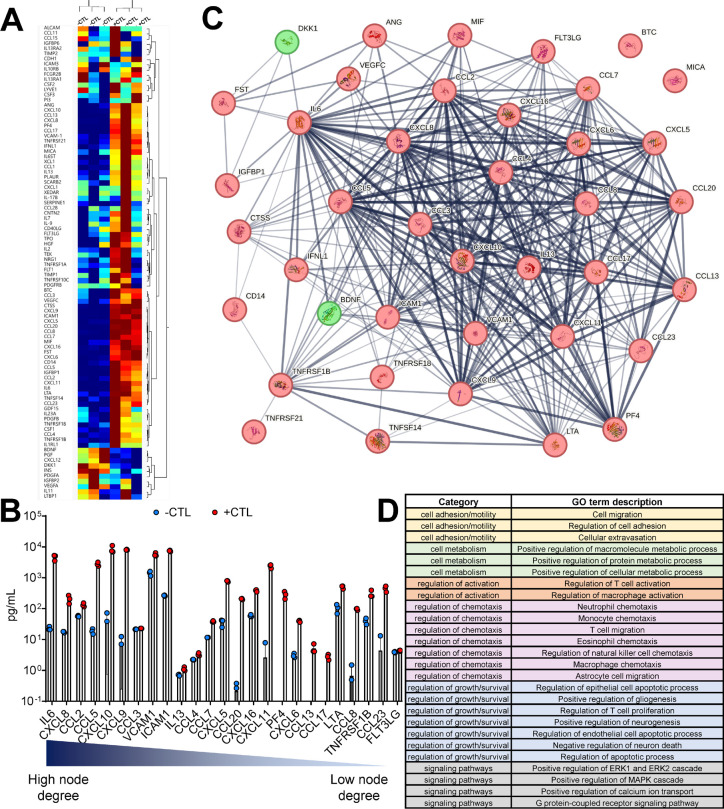
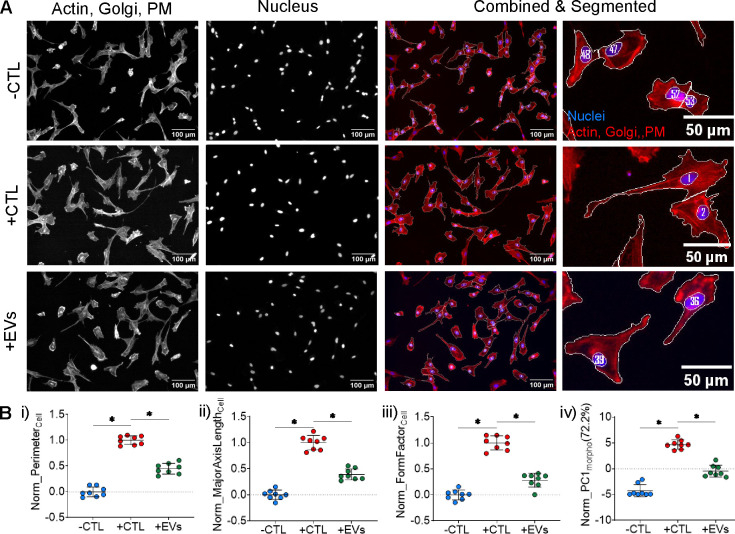
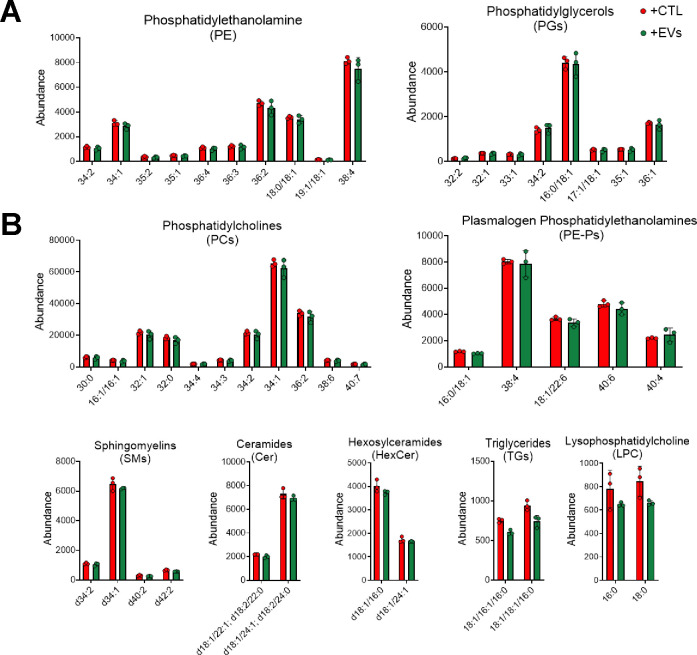
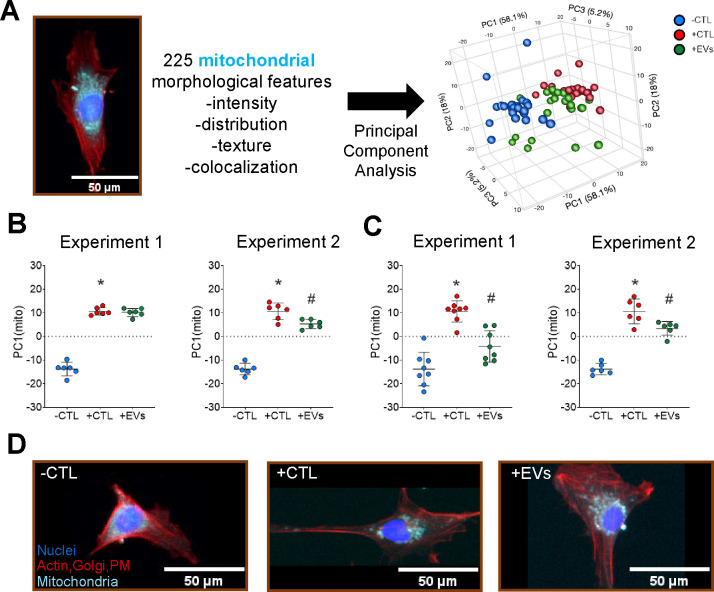
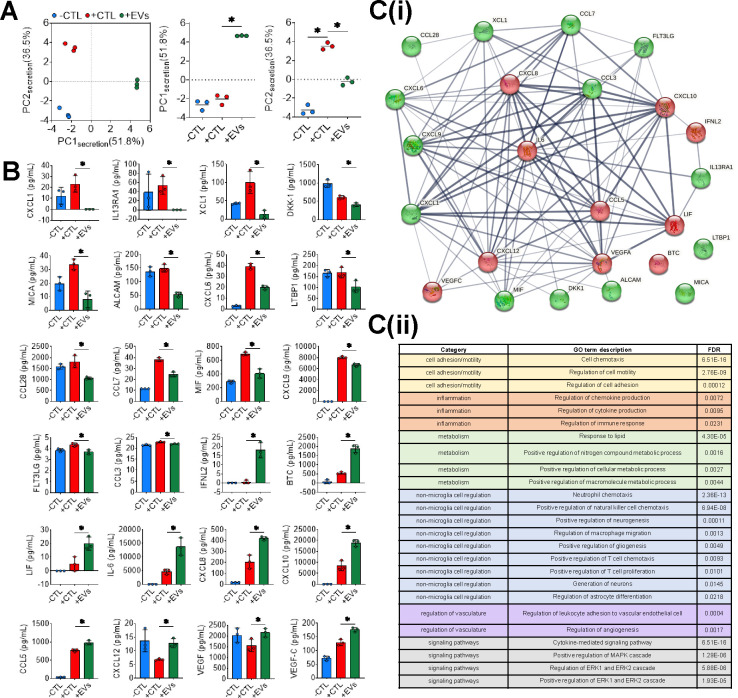
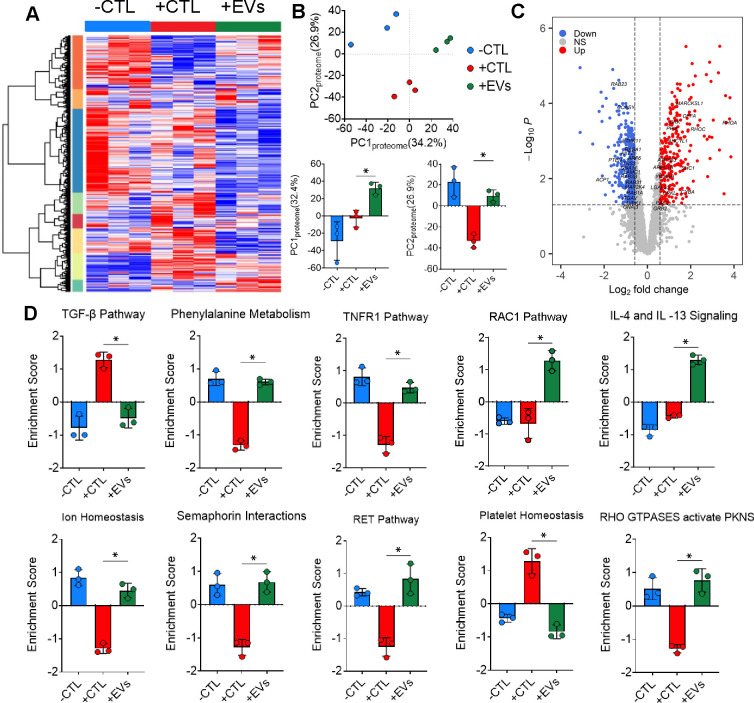
Results: Using an immortalized human microglia cell-line, we observed increased size (perimeter, major axis length) and complexity (form factor) upon stimulation with interferon-gamma (IFN-γ) and tumor necrosis factor-alpha (TNF-α). Upon treatment with MSC-EVs, the overall morphological score (determined using principal component analysis) shifted towards the unstimulated morphology, indicating that MSC-EVs are bioactive and modulate microglia. The morphological effects of MSC-EVs in TNF-γ/IFN-α stimulated cells were concomitant with reduced secretion of 14 chemokines/cytokines (e.g. CXCL6, CXCL9) and increased secretion of 12 chemokines/cytokines (e.g. CXCL8, CXCL10). Proteomic analysis of cell lysates revealed significant increases in 192 proteins (e.g. HIBADH, MEAK7, LAMC1) and decreases in 257 proteins (e.g. PTEN, TOM1, MFF) with MSC-EV treatment. Of note, many of these proteins are involved in regulation of cell morphology and migration. Gene Set Variation Analysis revealed upregulation of pathways associated with immune response, such as regulation of cytokine production, immune cell infiltration (e.g. T cells, NK cells) and morphological changes (e.g. Semaphorin, RHO/Rac signaling). Additionally, changes in microglia mitochondrial morphology were measured suggesting that MSC-EV modulate mitochondrial metabolism.

Conclusion: This study comprehensively demonstrates the effects of MSC-EVs on human microglial morphology, cytokine secretion, cellular proteome, and mitochondrial content. Our high-throughput, rapid, low-cost morphological approach enables screening of MSC-EV batches and manufacturing conditions to enhance EV function and mitigate EV functional heterogeneity in a disease relevant manner. This approach is highly generalizable and can be further adapted and refined based on selection of the disease-relevant signal, target cell, and therapeutic product.

Keywords: Mesenchymal stromal cell-derived extracellular vesicles (MSC-EVs); Microglia; lipidomics; mitochondria; morphology; neuroinflammation; proteomics; secretion.


Conflict of interest statement

Competing Interests The authors have no competing interests to declare. The views presented in this article do not necessarily reflect the current or future opinion or policy of the US Food and Drug Administration.

Figures

Figure 1:
Figure 1:. Microglia morphology changes upon activation with cytokines.
(A) Representative images of C20 microglia in −CTL group (unstimulated) and +CTL group (stimulated with 5ng/mL each of IFN-γ and TNF-α). Actin, Golgi & plasma membrane (PM) (Red, Phalloidin/WGA), Nuclei (Blue, Hoechst): Scale bar=100μm (B) Individual cellular features (i) Perimeter, (ii) Form Factor and (iii) Aspect Ratio and (iv) Principal component 1 (PC1morpho) calculated using 21 features. Each point is a median of ~700–1000 cells/Fig 1Bwell with mean and standard deviation plotted for n=8 wells per group. *p<0.01 vs −CTL for all groups conducted using unpaired t-test with Welch’s correction. (C, D) Experimental and Operator variability: Microglia controls (−CTL vs +CTL) are significantly different across multiple experiments and operators. p<0.001 vs +CTL for all experiments using 2-way ANOVA with Šídák’s multiple comparisons test. (E) Z-factor for PC1morpho is > 0.5 (dotted line) for 7/8 experiments.
Figure 2:
Figure 2:. Microglia lipid content increases upon activation with cytokines.
(A) Overall cellular lipid content across different lipid classes increases following stimulation (+CTL). Lipid classes identified using negative mode (A) and positive mode (B) ionization. Each lipid species significantly different between –CTL and +CTL (p<0.05) except LPC (denoted by ‘ns’) using unpaired t-test with Welch’s correction. (C) Pathways ordered by p-value significance (1-log10(p-val)) with significantly enriched pathways above red horizontal line at p-value cutoff = 0.05.
Figure 3:
Figure 3:. Effects of cytokine stimulation on microglia secretion.
(A) Heatmap representing microglia proteins that change following IFN-γ/TNF-α stimulation (−CTL vs +CTL). Two-way hierarchical clustering using Ward method. (B) STRING database generated network map of proteins increased (red) and decreased (green) after stimulation (+CTL) and their predicted functional associations (edges). Thicker and darker edges (line connecting 2 proteins), implies higher level of confidence in the interactions and correlation between the proteins (http://version10.string-db.org/help/faq/). (C) Proteins that are significantly different between controls and arranged in descending order of their number of functional associations (node degrees). p<0.05 using unpaired t-test with Welch correction for all proteins. (D) Pathways associated with changes in microglia secretion post stimulation.
Figure 4:
Figure 4:. Stimulated microglia morphology changes upon treatment with MSC-EVs.
(A) Representative images of C20 microglia cells in −CTL group (unstimulated), +CTL group (stimulated with 5ng/mL each of IFN-γ and TNF-α) and +CTL+EVs (stimulated with 5ng/mL each of IFN-γ and TNF-α + treated with MSC-EVs). Actin, Golgi & plasma membrane (PM) (Red, Phalloidin/WGA), Nuclei (Blue, Hoechst), Scale bars =100 μm (columns 1–3 images) and 50 μm (column 4 images). (B) Individual min-max normalized cellular features (i) Perimeter, (ii) Major Axis Length and (iii) Form Factor. (iv)Normalized principal component 1(PC1morpho) calculated using 21 min-max normalized features represents 72.2% of the variance. Each point is a median of ~700–1000 cells/well. Bar indicates the mean of the 8 wells/group. *p<0.001 vs +CTL for all groups conducted using Brown-Forsythe and Welch one-way ANOVA with multiple corrections using Dunnett T3 testing.
Figure 5:
Figure 5:. Microglia lipid content remains unchanged with MSC-EV treatment.
Similar amount of lipids observed between the stimulated (+CTL) and MSC-EV treated (+EVs) microglia. Lipid classes identified using negative mode (A) and positive mode (B) ionization. P>0.05 vs +CTL for all lipids calculated using unpaired t-test with Welch’s correction.
Figure 6:
Figure 6:. Microglia mitochondrial morphology altered by MSC-EV treatment.
(A) Representative image of microglia mitochondria (Cyan) used to calculate single-cell features. Principal component analysis indicates maximum variance in PC1mito (58.1% variance) (B &C) PC1mito used as composite mitochondrial morphological score to assess effects of with (+CTL) and without (−CTL) cytokine stimulation and concurrent treatment with MSC-EVs (+EVs). Assay conducted on Costar Cat#3603 (B) and Greiner Cat#655090 (C) 96-well plates, respectively. *p<0.05 vs −CTL and #p<0.05 vs +CTL conducted using Brown-Forsythe and Welch one-way ANOVA with multiple corrections using Dunnett T3 test. (D) Representative images of mitochondria from each experimental group. Actin, Golgi & plasma membrane (PM) (Red, Phalloidin/WGA), Nuclei (Blue, Hoechst) and Mitochondria (Cyan, Mitotracker Deep Red), Scale: 50μm.
Figure 7:
Figure 7:. Microglia secretion profile is altered post MSC-EV treatment.
(A) Individual clusters of −CTL (blue), +CTL (red) and +EVs (green) observed with PCA conducted using 24 proteins that were different between +CTL and +EVs. PC1secretion (51.8% variance) and PC2secretion (36.5% variance) account for 88.3% of total variance. (B) Observed changes in secretion of individual proteins (14 decreased, 10 increased) with concurrent MSC-EV treatment. *p<0.05 conducted using unpaired t test with Welch correction. (C(i)) STRING database generated network map of for group of proteins decreased (green) and increased (red) after MSC-EV treatment and their predicted functional associations (edges). Thicker and darker edges (line connecting 2 proteins), implies higher level of confidence in the interactions and correlation between the proteins (http://version10.string-db.org/help/faq/). (C(ii)) Pathways associated with changes in microglia secretion following MSC-EV treatment.
Figure 8:
Figure 8:. Microglia proteomic profile shifts after cytokine stimulation and with MSC-EV treatment.
(A) Heatmap representing the 2662 proteins identified using LC-MS/MS and clustered based on Euclidian distance across all 3 experimental groups. (B) PCA reveals overall change in protein profile with PC1proteome (34.2% variance) accounting for alternate protein expression and PC2proteome (26.9% variance) accounting for shift in protein expression towards −CTL after MSC-EV treatment. (C) Volcano plot depicting alterations in protein expression upon MSC-EV treatment vs +CTL. (D) Subset of enriched pathways identified using GSVA analysis. *p<0.05 conducted using ANOVA followed by Tukey post-hoc test, then Benjamini–Hochberg false discovery rate (FDR) adjustment for multiple comparisons were used. FDR adjusted p-values≤0.05 were considered to be significant.

Similar articles

References

    1. Ferreira JR, Teixeira GQ, Santos SG, Barbosa MA, Almeida-Porada G, Gonçalves RM . Mesenchymal stromal cell secretome: Influencing therapeutic potential by cellular pre-conditioning. Frontiers in Immunology. 2018. - PMC - PubMed
    1. Valdearcos M, Robblee MM, Benjamin DI, Nomura DK, Xu AW, Koliwad SK. Microglia Dictate the Impact of Saturated Fat Consumption on Hypothalamic Inflammation and Neuronal Function. Cell Rep. 2014. Dec 24;9(6):2124–38. - PMC - PubMed
    1. Ruppert KA, Nguyen TT, Prabhakara KS, Toledano Furman NE, Srivastava AK, Harting MT, et al. Human Mesenchymal Stromal Cell-Derived Extracellular Vesicles Modify Microglial Response and Improve Clinical Outcomes in Experimental Spinal Cord Injury. Sci Rep. 2018;8(1):1–12. - PMC - PubMed
    1. Varderidou-Minasian S, Lorenowicz MJ. Mesenchymal stromal/stem cell-derived extracellular vesicles in tissue repair: Challenges and opportunities. Vol. 10, Theranostics. Ivyspring International Publisher; 2020. p. 5979–97. - PMC - PubMed
    1. Tkach M, Théry C. Communication by Extracellular Vesicles: Where We Are and Where We Need to Go. Vol. 164, Cell. Cell Press; 2016. p. 1226–32. - PubMed

Publication types