[Preprint]. 2024 Sep 26:2024.06.30.601444.
doi: 10.1101/2024.06.30.601444.

A side-by-side comparison of variant function measurements using deep mutational scanning and base editing

Affiliations

A side-by-side comparison of variant function measurements using deep mutational scanning and base editing

Ivan Sokirniy et al. bioRxiv. .

Update in

Abstract

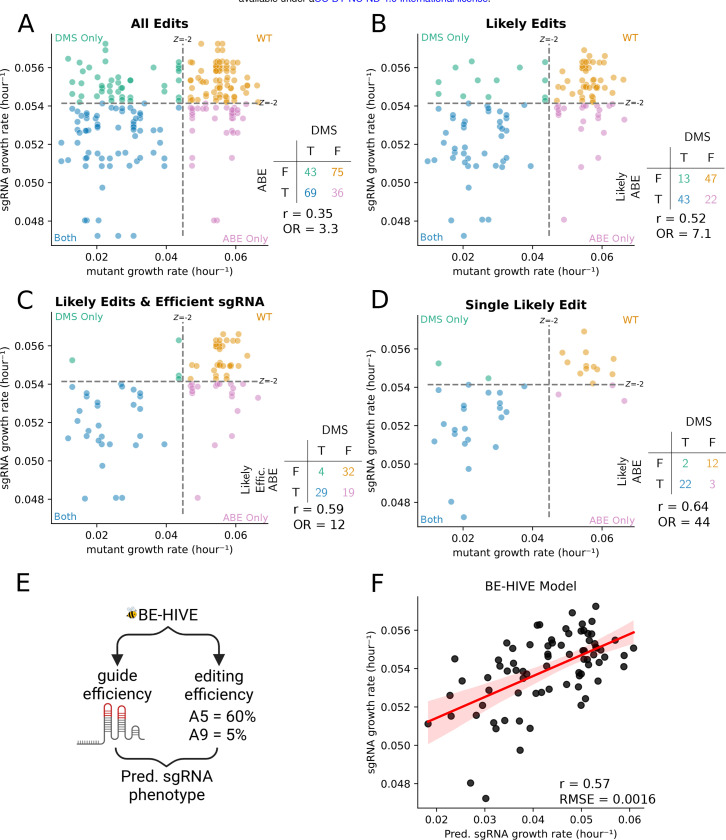
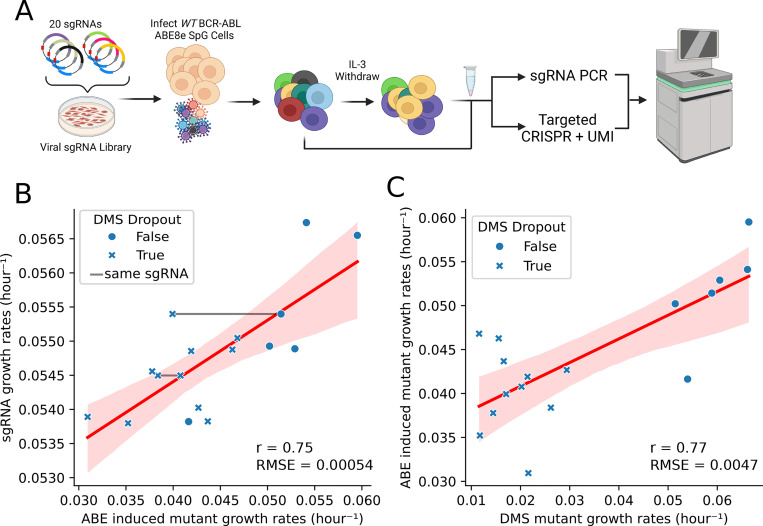
Variant annotation is a crucial objective in mammalian functional genomics. Deep Mutational Scanning (DMS) is a well-established method for annotating human gene variants, but CRISPR base editing (BE) is emerging as an alternative. However, questions remain about how well high-throughput base editing measurements can annotate variant function and the extent of downstream experimental validation required. This study presents the first direct comparison of DMS and BE in the same lab and cell line. Results indicate that focusing on the most likely edits and highest efficiency sgRNAs enhances the agreement between a "gold standard" DMS dataset and a BE screen. A simple filter for sgRNAs making single edits in their window could sufficiently annotate a large proportion of variants directly from sgRNA sequencing of large pools. When multi-edit guides are unavoidable, directly measuring the variants created in the pool, rather than sgRNA abundance, can recover high-quality variant annotation measurements in multiplexed pools. Taken together, our data show a surprising degree of correlation between base editor data and gold standard deep mutational scanning.


Conflict of interest statement

JRP is a co-founder of RedAce Bio. JRP was a co-founder and consultant for Theseus Pharmaceuticals. JRP held equity in Theseus Pharmaceuticals. JRP holds equity in MOMA therapeutics and RedAce Bio. JRP has consulted/consults for MOMA therapeutics, Curie.Bio, Third Rock Ventures, Takeda Pharmaceuticals, Galapagos Pharmaceuticals, and Roche/Genentech. JRP has received honoraria and travel expenses from Roche/Genentech, Third Rock Ventures, and Theseus Pharmaceuticals.

Figures

Figure 1.
Figure 1.. Functional landscape of ABL N-Lobe
(A) Schematic of deep mutational scanning. After lentiviral integration of EGFP-P2A-BCR-ABL, BaF3s were sorted to enrich EGFP+ infected cells. Cells were pelleted before and 6 days after IL-3 withdrawal. After targeted genomic DNA digest by Cas9, single molecules of DNA were labeled by UMI ligation. Then biotinylated oligo baits were used to enrich the mutagenized region. (B) The distribution of mutant growth rates in the ABL N-lobe is bimodal. Two skewed gaussians are fit to determine the variation in deleterious (blue) and “wild-type like” (orange) mutations. The dotted line represents a −2 Z-score threshold with respect to the “wild type-like” distribution. (C) Heatmap of the growth rate of mutations at each position in ABL1 N-lobe. Black dot represents WT positions. Missing data is in white. Second to the last row of the heatmap provides surface exposure information because solvent exposed residues (red, “e”) tend to be more tolerant of mutations than buried residues (blue, “b”). Tolerance/sensitivity to mutagenesis is projected onto two key structural features of the ABL N-lobe (PDB 6XR6): the (D) anti-parallel beta-sheet, and the (E) αC-Helix. If mean growth rate of alternative alleles at a residue is less than the −2 Z-score cutoff, then the residue is colored blue. In contrast, if the mean growth rate of alternative alleles is greater than the –2 Z-score cutoff, then it is colored in red.
Figure 2.
Figure 2.. Adenosine Base Editor screen of full length of BCR-ABL.
(A) Schematic of adenosine base editor screen. Three days after infection with sgRNA library, EGFP-P2A-BCR-ABL1 ABE8e BaF3 were selected with 1mg/mL hygromycin for 6 days and pelleted. Guides were PCR amplified and sequenced. (B) Sliding window of 40 sgRNAs estimate of the proportion of BCR-ABL sgRNAs that drop out more than a Z-score of −4 of the non-targeting control sgRNA growth rate. (C) Kernel density estimate of growth rate distributions of non-targeting control, and BCR-ABL sgRNA libraries. Dashed grey line represents a – 2 Z-score of the targeting control. (D) Lollipop plot displays dropout of each sgRNA across the ABL kinase domain. Dashed grey line represents a –2 Z-score of the targeting control.
Figure 3.
Figure 3.. Comparison of Adenosine Base Editor sgRNA growth rate and their respective mutation growth rates from Deep Mutational Scan.
Each dot represents a mutation an sgRNA is predicted to make. Dashed lines represent –2 Z-score of the non-deleterious distribution and non-targeting control sgRNA for the DMS and ABE screens, respectively. These cutoffs are used to define if an sgRNA or mutation is deleterious. If an sgRNA and its mutation does not deplete in their respective screen, in other words both are non-deleterious, then they are colored orange. If they both are deleterious, or true positive, then they are colored blue. If an sgRNA deletes, but the predicted edit does not deplete, a false positive, then the dot is colored in the pink. If a sgRNA fails to deplete and the predicted mutation(s) are deleterious, a false negative, then that point is colored in green. (A) shows all possible edits between nucleotides 2 and 12. (B) shows only the most likely edits, those between nucleotides 4 and 8. (C) shows only sgRNA predicted to be efficient and edit between nucleotides 4 and 8. (D) shows sgRNAs that are predicted to make only a single edit between nucleotides 4 and 8. (E) The distribution of edits can be estimated by machine learning model called BE-HIVE. (F) Correlation between predicted sgRNA growth rate and observed sgRNA growth rate. The x-axis shows the predicted growth rate of each sgRNA based on a weighted sum of the probability edit(s) and the effect of that edit(s) from DMS data. The y-axis shows the measured growth rate of the efficiently editing sgRNAs from the ABE screen.
Figure 4.
Figure 4.. Medium-throughput pooled Adenosine Base Editor Screen.
(A) Schematic of small screen of 20 sgRNAs targeting ABL kinase, where the edits and sgRNA are sequenced after IL-3 withdrawal. (B) Comparison of measured sgRNA and single amino acid edit growth rates. If the mutation is deleterious or non-deleterious in the DMS data, then it is marked by a X or closed circle, respectively. If the different mutations are made by the same sgRNA, then they are connected by a grey line. (C) Represents a direct comparison between the measured growth rate of single amino acid mutants during the DMS and 20 sgRNA ABE screens.

Similar articles

References

    1. Kinney J.B. and McCandlish D.M. (2019) Massively Parallel Assays and Quantitative Sequence-Function Relationships. Annu Rev Genomics Hum Genet, 20, 99–127. - PubMed
    1. Elbashir S.M., Harborth J., Lendeckel W., Yalcin A., Weber K. and Tuschl T. (2001) Duplexes of 21-nucleotide RNAs mediate RNA interference in cultured mammalian cells. Nature, 411, 494–498. - PubMed
    1. Root D.E., Hacohen N., Hahn W.C., Lander E.S. and Sabatini D.M. (2006) Genome-scale loss-of-function screening with a lentiviral RNAi library. Nat Methods, 3, 715–719. - PubMed
    1. Fire A., Xu S., Montgomery M.K., Kostas S.A., Driver S.E. and Mello C.C. (1998) Potent and specific genetic interference by double-stranded RNA in Caenorhabditis elegans. Nature, 391, 806–811. - PubMed
    1. Ran F.A., Hsu P.D., Wright J., Agarwala V., Scott D.A. and Zhang F. (2013) Genome engineering using the CRISPR-Cas9 system. Nat Protoc, 8, 2281–2308. - PMC - PubMed

Publication types

LinkOut - more resources