[Preprint]. 2025 May 31:2024.06.27.601073.
doi: 10.1101/2024.06.27.601073.

Detecting branching rate heterogeneity with tree balance statistics in lineage tracing trees

Affiliations

Detecting branching rate heterogeneity with tree balance statistics in lineage tracing trees

Yingnan Gao et al. bioRxiv. .

Abstract

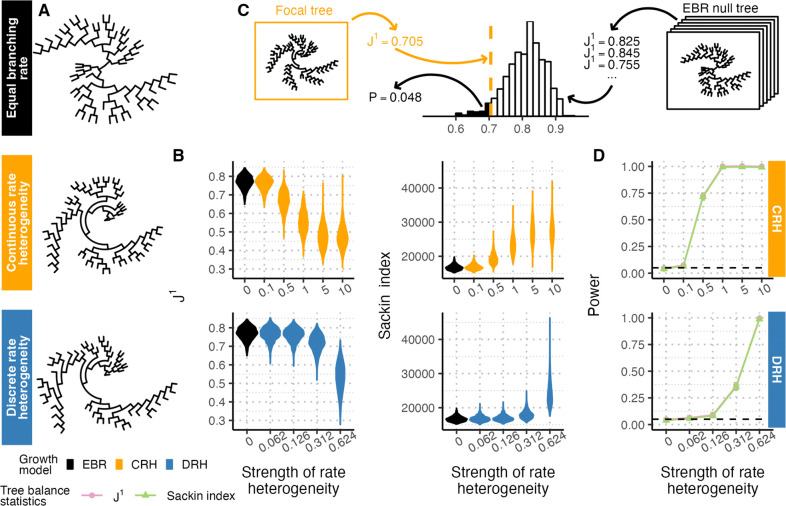
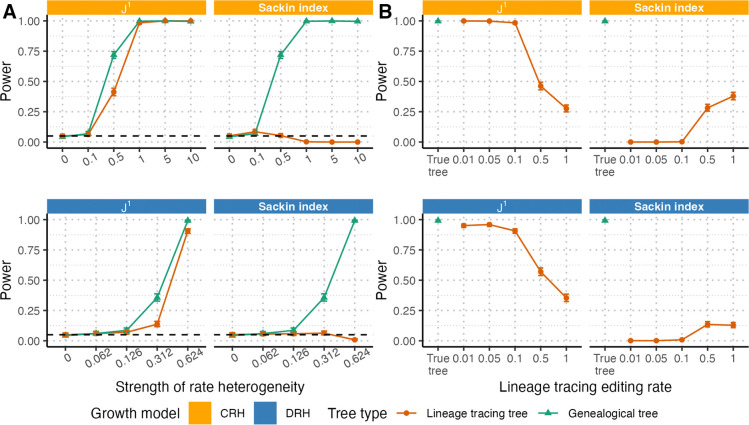
Understanding variation in cellular growth rates among cells in tumors is crucial for predicting cancer progression and interpreting tumor-derived genetic data. Advances in lineage tracing technologies enable the reconstruction of high-resolution, single-cell phylogenies of cancer cell populations, but methods to detect cellular growth rate differences on these phylogenies remain limited. Tree balance statistics offer a way forward, but it is unknown if and how these statistics are distorted when applied to phylogenetic reconstructions built from lineage tracing data, and if these distortions limit the utility of tree balance statistics to distinguish between evolutionary scenarios characterized by variable or homogeneous cellular growth rates. Here, we examined two tree balance statistics, J 1 and the Sackin index, and benchmarked their performance in distinguishing lineage tracing trees derived from populations with and without variable cellular growth rates. We found that when tumor population sizes and lineage tracing editing rates are approximately known and in favorable ranges, J 1 detects departures from homogenous growth rates just as well on lineage tracing trees as on true genealogical trees, while the Sackin index loses most of its power even under the most favorable conditions. We applied our J 1 -based test to data derived from cancer lineage tracing experiments and found widespread signals of growth rate heterogeneity in murine autochthonous lung cancers, and lung and PDAC xenograft experiments in mice. Our results demonstrate the potential and challenges of tree balance statistics in analyzing growth dynamics in lineage tracing data.

Keywords: CRISPR-Cas9; J1; Sackin index; tree topology; tumor growth dynamics.


Figures

Figure 1.
Figure 1.. Branching rate heterogeneity affects tree balance as measured by J1 and the Sackin index.
(A) Genealogical trees simulated without rate heterogeneity (equal branching rate, or EBR, black) and with rate heterogeneity show visually distinct balance properties. Models of continuous rate heterogeneity (CRH, yellow) and discrete rate heterogeneity (DRH, blue) used a rate heterogeneity strength of 1.0 and 0.624, respectively. Trees are subsampled to 50 tips. (B) Distributions of J1 (left) and the Sackin index (right) for genealogical trees simulated with different strengths of branching rate heterogeneity for CRH (top, rate strengths {0,0.1,0.5,1,5,10}) and DRH (bottom, rate strengths {0,0.062,0.126,0.312,0.624}) models. Each distribution summarizes over 1000 replicates. (C) Schematic of a statistical approach to compare a focal tree’s balance to an empirical distribution of tree balance under equal branching rates. (D) Tests based on J1(pink) and the Sackin index (green) are powered to detect departures from EBR in genealogical trees. Solid lines show test power, black dashed lines show the significance level (α=0.05), and error bars show 95% confidence intervals from 1000 replicates. Throughout the figure, simulated trees are size 6250 downsampled to 1250 tips unless otherwise noted.
Figure 2.
Figure 2.. Lineage tracing reconstruction distorts tree topologies and balance.
(A) To transform simulated genealogical trees into lineage tracing trees, we used the Cas-9 simulator in Cassiopeia to simulate barcode editing, and the MaxCut algorithm to reconstruct tree topologies. Larger rectangles represent editing cassettes composed of individual target sites as squares. Target sites are depicted as white when unedited and colored when edited. (B) Reconstructed lineage tracing trees under all three models (rows, EBR, CRH, DRH) have distorted topologies dependent on underlying edit rate (columns, μedit{0.01,0.1,1.0}. Star and star-like polytomies are marked in red and purple, respectively. Trees shown are size 6250 and downsampled to 50 tips for visualization purposes. Reconstructed trees across editing rates (μedit{0.01,0.05,0.1,0.5,1.0}) and rate heterogeneity models show widespread star and star-like polytomies (C), decreased node-to-tip ratios (D), and sister clade size ratios (E) when compared to true genealogical trees (far left). Error bars represent interquartile ranges. (F) Topological distortions also affect J1 (left) and the Sackin index (right) for both CRH and DRH. Throughout the figure, CRH and DRH trees have a rate heterogeneity strength of 1.0 and 0.624, respectively, and trees are simulated up to size 6250 and downsampled to 1250 tips unless otherwise noted. Each frequency, ratio or distribution summarizes over 1000 replicates.
Figure 3.
Figure 3.. Power of J1 and Sackin index-based test for branching rate heterogeneity on trees derived from lineage tracing data.
For both CRH (top) and DRH (bottom), we evaluated the power of the test illustrated in Figure 1C to detect branching rate heterogeneity using J1 (left) and the Sackin index (right) on reconstructed lineage tracing trees rather than genealogical trees. (A) For editing rate μedit=0.1, we found that while J1-based tests retained nearly all of their power to detect rate heterogeneity on lineage tracing trees as compared to genealogical trees across different strengths of rate heterogeneity ({0.1,0.5,1,5,10} for CRH and {0.062,0.126,0.312,0.624} for DRH), Sackin index-based tests did not. (B) On trees with strong rate heterogeneity (1.0 and 0.624, for CRH and DRH, respectively) and variable editing rates (μedit{0.01,0.05,0.1,0.5,1}), higher lineage tracing editing rates lowered J1 test power compared to the test performed on the true trees (left). For the Sackin index, test power was 0 for low editing rates, but increased marginally for higher editing rates. Throughout these figures, solid lines indicate test power, dashed black lines indicate the significance level (α=0.05), and error bars indicate 95% confidence intervals from 1000 replicates. All trees are simulated up to size 6250 and downsampled to 1250 tips.
Figure 4.
Figure 4.. Branching rate heterogeneity is widespread in three in vivo lineage tracing datasets.
We plot reconstructed tree topologies from three in vivo lineage tracing studies of cancer cell lines or autochthonous lung cancers. Trees with a significant departure from EBR are displayed in red, while those without are displayed in black. All trees are uniformly trimmed down to 100 tips for display, but full size trees can be found in Figure S7.

Similar articles

References

    1. Alves JM, Prado-López S, Cameselle-Teijeiro JM, Posada D. 2019. Rapid evolution and biogeographic spread in a colorectal cancer. Nat. Commun. 10:5139. doi: 10.1038/s41467-019-12926-8. - DOI - PMC - PubMed
    1. Baslan T et al. 2020. Novel insights into breast cancer copy number genetic heterogeneity revealed by single-cell genome sequencing. eLife. 9:e51480. doi: 10.7554/eLife.51480. - DOI - PMC - PubMed
    1. Bian S et al. 2018. Single-cell multiomics sequencing and analyses of human colorectal cancer. Science. 362:1060–1063. doi: 10.1126/science.aao3791. - DOI - PubMed
    1. Borgsmüller N, Valecha M, Kuipers J, Beerenwinkel N, Posada D. 2023. Single-cell phylogenies reveal changes in the evolutionary rate within cancer and healthy tissues. Cell Genomics. 3:100380. doi: 10.1016/j.xgen.2023.100380. - DOI - PMC - PubMed
    1. Bozic I et al. 2010. Accumulation of driver and passenger mutations during tumor progression. Proc. Natl. Acad. Sci. 107:18545–18550. doi: 10.1073/pnas.1010978107. - DOI - PMC - PubMed

Publication types

LinkOut - more resources