[Preprint]. 2024 Jul 1:2024.06.27.601041.
doi: 10.1101/2024.06.27.601041.

Sulfur Amino Acid Restriction Enhances Exercise Capacity in Mice by Boosting Fat Oxidation in Muscle

Affiliations

Sulfur Amino Acid Restriction Enhances Exercise Capacity in Mice by Boosting Fat Oxidation in Muscle

Charlotte G Mann et al. bioRxiv. .

Abstract

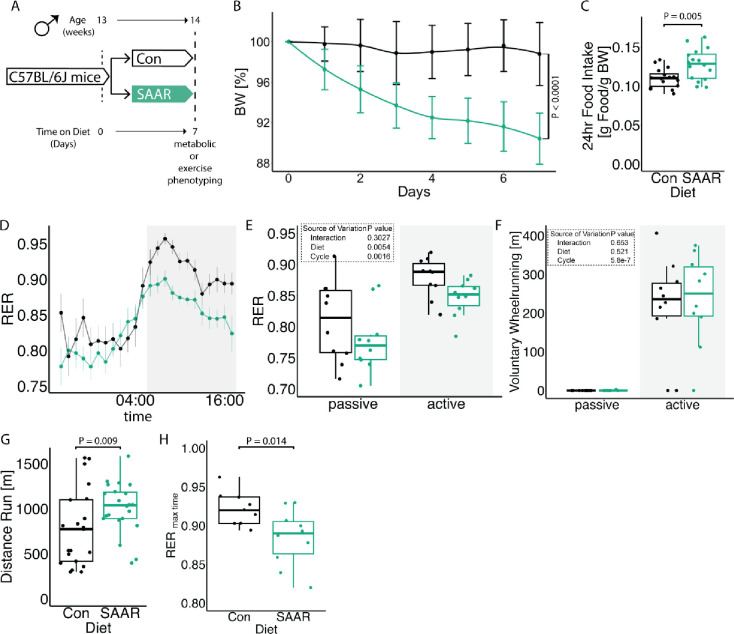
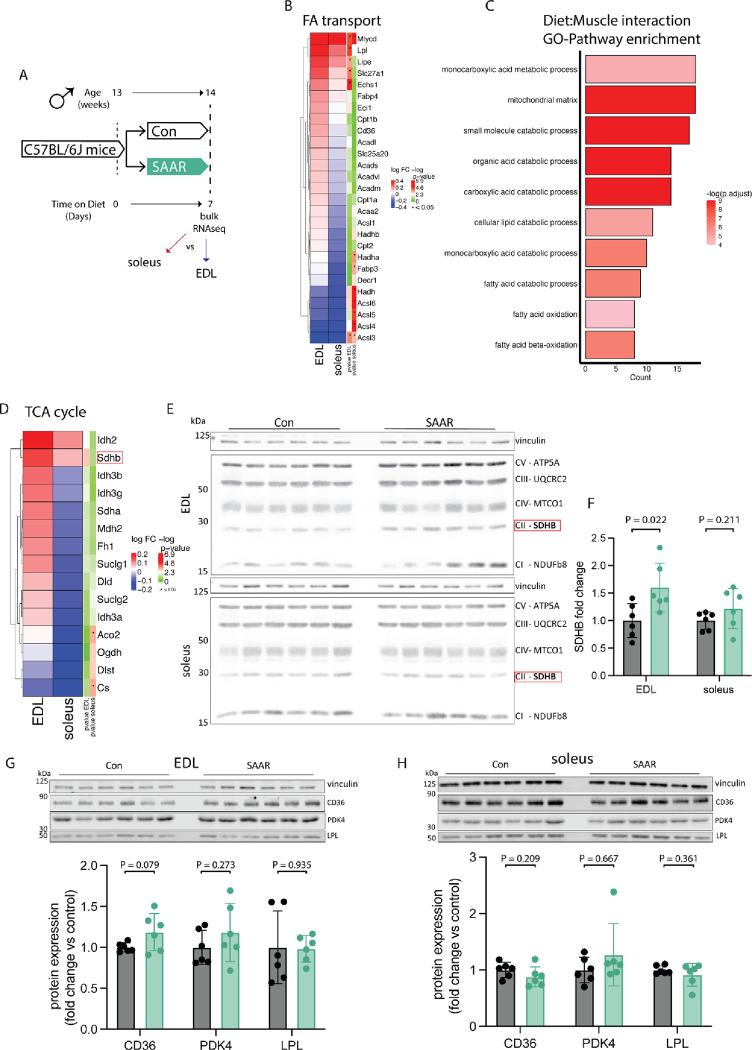
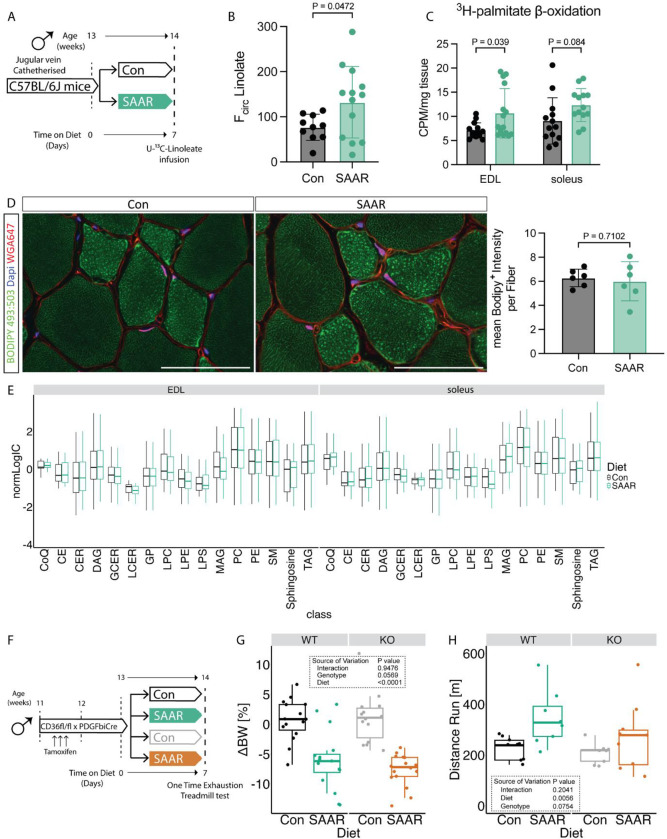
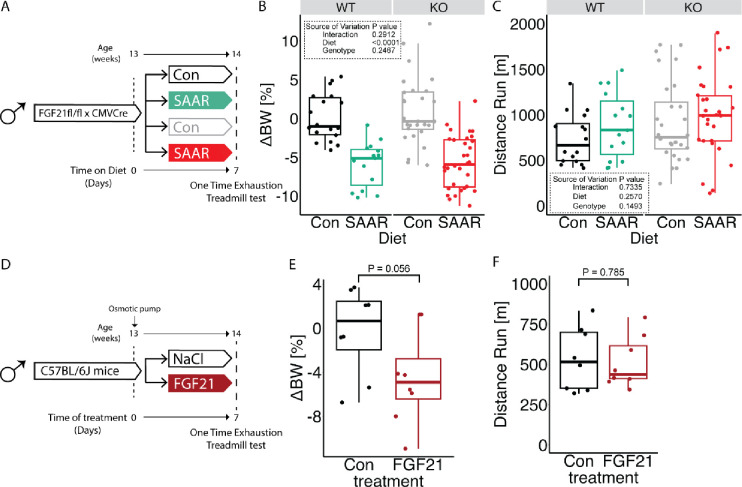
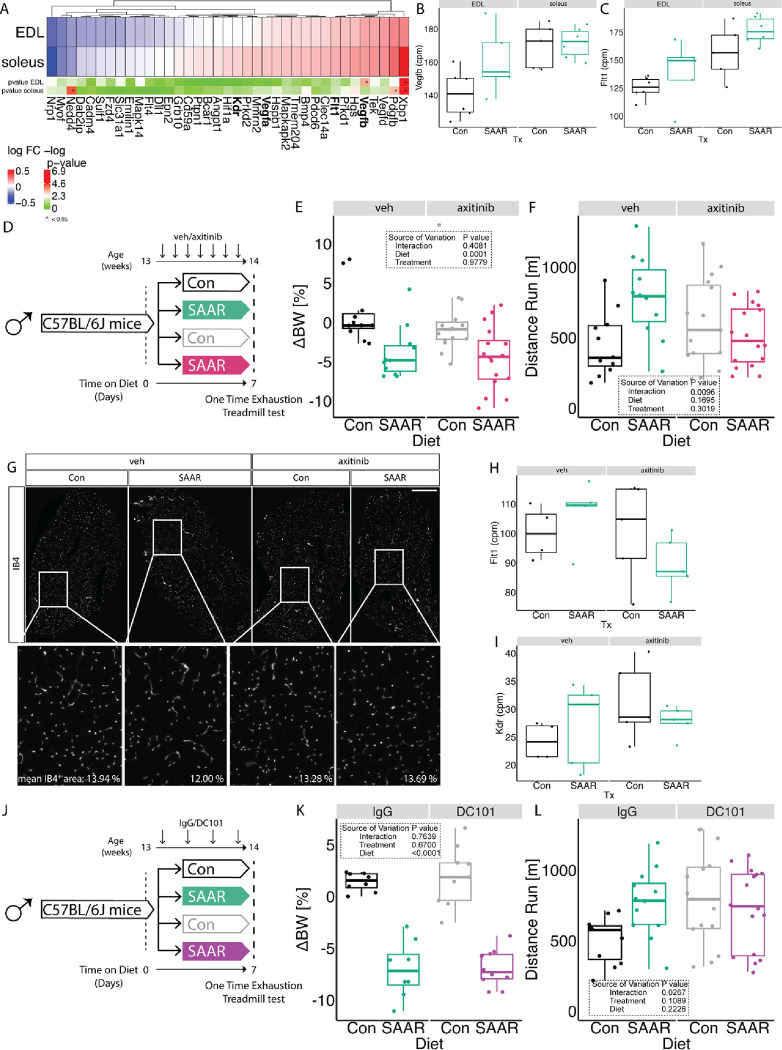
Dietary restriction of the sulfur-containing amino acids methionine and cysteine (SAAR) improves body composition, enhances insulin sensitivity, and extends lifespan; benefits seen also with endurance exercise. Yet, the impact of SAAR on skeletal muscle remains largely unexplored. Here we demonstrate that one week of SAAR in sedentary, young, male mice increases endurance exercise capacity. Indirect calorimetry showed that SAAR increased lipid oxidation at rest and delayed the onset of carbohydrate utilization during exercise. Transcriptomic analysis revealed increased expression of genes involved in fatty acid catabolism especially in glycolytic muscle following SAAR. These findings were functionally supported by increased fatty acid circulatory turnover flux and muscle β-oxidation. Reducing lipid uptake from circulation through endothelial cell (EC)-specific CD36 deletion attenuated the running phenotype. Mechanistically, VEGF-signaling inhibition prevented exercise increases following SAAR, without affecting angiogenesis, implicating noncanonical VEGF signaling and EC CD36-dependent fatty acid transport in regulating exercise capacity by influencing muscle substrate availability.


Conflict of interest statement

Declaration Of Interests The authors declare no competing interests.

Figures

Figure 1
Figure 1. Short-term SAAR induces shifts in metabolism and increases endurance exercise capacity in young, sedentary, male mice.
A. Experimental set up and color scheme used throughout figure 1 and figure S1. B. Body weight trajectory over time, shown as percent of starting body weight (n = 10) of male mice given ad libitum access to sulfur amino acid restricted (SAAR) versus control (Con) diet for seven days. C. Food intake expressed as grams of food per gram of body weight per mouse within a 24 h period (n = 10) of male mice given ad libitum access to SAAR versus Con diet on day seven. D. Sable systems indirect calorimetry measurements of respiratory exchange ratios (CO2 emission/O2 consumption, VCO2/VO2, RER) over a 24 h period (n = 10) and E. the average RER during a 12 h – 12 h light–dark cycle (n = 10/group) of male mice given ad libitum access to SAAR versus Con diet on day seven. F. The average wheel running in meter during a 12 h – 12 h light–dark cycle (n = 10) of male mice given ad libitum access to SAAR versus Con diet on day seven. G. Distance ran in meter during a one-time maximal endurance test (n = 20) of male mice given ad libitum access to SAAR versus Con diet on day seven. H. Quantification of RER at maximal exercise time, during a one-time maximal endurance test, performed on a metabolic treadmill (Harvard Apparatus) (n = 10) of male mice given ad libitum access to SAAR versus Con diet on day seven. All data is shown as mean and error bars indicate SD unless otherwise noted; p values indicate the significance of the difference by Student’s t test or two-way ANOVA with Sidak’s multiple comparisons test between diets or diet and cycle (indirect calorimetry); significance is determined by a p value of p < 0.05. Each dot represents an individual mouse. See also Figure S1 and Table S1.
Figure 2
Figure 2. Transcriptomics across muscle depots reveal metabolic shift from glycolytic toward oxidative
A. Experimental set up and color scheme used throughout figure 2 and figure S2. B. Fold changes of transcripts associated with fatty acid (FA) catabolism and transport as identified in supplementary figure 2A in muscle of male mice (n = 6) given ad libitum access to sulfur amino acid restricted (SAAR) versus control (Con) diet for seven days. C. Pathway enrichment analysis of genes showing significant diet by muscle interaction effects. D. Fold changes (SAAR vs Con) of TCA cycle genes in EDL and soleus. E. Representative blots of electron transport chain complexes and F. quantification of relative protein abundance normalized to vinculin of SDHB for EDL and soleus (n = 6) of male mice given ad libitum access to SAAR versus Con diet on day seven. G. Representative blots of CD36, LPL and PDK4 and vinculin (top) and quantification of relative protein abundance normalized to vinculin of CD36, PDK4, and LPL (bottom) in EDL (n = 6) of male mice given ad libitum access to SAAR versus Con diet on day seven. H. Representative blots of CD36, LPL and PDK4 and vinculin (top) and quantification of relative protein abundance normalized to vinculin of CD36, PDK4, and LPL from blots (bottom) in soleus (n = 6) of male mice given ad libitum access to SAAR versus Con diet on day seven. All data is shown as mean and error bars indicate SD unless otherwise noted; p values indicate the significance of the difference by Student’s t test between diets; significance is determined by a p value of p < 0.05. See also Figure S2 and Table S2.
Figure 3
Figure 3. SAAR increases muscle lipid flux without altering lipid pool sizes
A. Experimental design and color scheme used in figure 3A–E and figure S3A. B. Circulatory carbon flux (n = 10–13) of 13C18-U-Linolate of jugular vein catheterized male mice given ad libitum access to sulfur amino acid restricted (SAAR) versus control (Con) diet for seven days. C. Ex vivo β-oxidation measured by incorporation of 3H-palmitic acid in 3H-H2O in muscles of male mice fed a Con or SAAR diet for seven days (n = 15). D. Representative fluorescence images (left) of BODIPY 493:503 (green), WGA647 (red) and dapi (blue) staining in EDL cross-sections (scale bar, 50 μm) and quantification of Bodipy+ Intensity within fibers (right) of male mice fed a Con or SAAR for seven days (n = 6). E. Lipidomics analysis from muscle of male mice fed a Con or SAAR diet for seven days (n = 6), summarized as normalized ion counts of each main lipid class. F. Experimental set up and color scheme used in figure 3 G–H and figure S3D–I. G. Percent change in body weight (n = 16) of male WT and ECCD36−/− mice given ad libitum access to SAAR versus Con diet after seven days. H. Distance ran during a one-time maximal endurance test (n = 8) of male WT and ECCD36−/− mice given ad libitum access to SAAR versus Con diet on day seven. All data is shown as mean and error bars indicate SD unless otherwise noted; p values indicate the significance of the difference by Student’s t test between diets, or two-way ANOVA with Sidak’s multiple comparisons test between diets and muscle or genotype; significance is determined by a p value of p < 0.05. See also Figure S3 and Table S3–5.
Figure 4
Figure 4. FGF21 is dispensable for increased running capacity upon SAAR
A. Experimental design and color scheme used in figure 4B–C and figure S4A–C. B. Percent change in body weight (n = 11 – 24) of male WT or FGF21KO mice given ad libitum access sulfur amino acid restricted (SAAR) versus control (Con) diet for seven days. C. Distance ran during a one-time maximal endurance test (n = 11 – 24) of male WT or FGF21KO mice given ad libitum access to SAAR versus Con diet on day seven. D. Experimental set up and color scheme used throughout E-F and figure S4D–E. E. Percent change in body weight (n = 8) of NaCl or recombinant FGF21 treated male mice for seven days. F. Distance ran during a one-time maximal endurance test (n = 8) of NaCl or recombinant FGF21 treated male mice on day seven. All data is shown as mean and error bars indicate SD unless otherwise noted; p values indicate the significance of the difference by Student’s t test between treatments, or two-way ANOVA with Sidak’s multiple comparisons test between diets and genotype; significance is determined by a p value of p < 0.05. See also Figure S4.
Figure 5
Figure 5. Inhibition of VEGFR signaling blocks increased endurance exercise capacity by SAAR
A. Fold changes of transcripts associated with Vegf signaling using transcriptomic dataset presented in figure 2 in muscles of male mice (n = 6) after sulfur amino acid restriction (SAAR) compared to control (Con) diet for seven days. B. Normalized count values of Vegfb in EDL and soleus from bulkRNA sequencing (n = 6) of male mice given ad libitum access to SAAR versus Con diet on day seven. C. Normalized count values of Flt1 in EDL and soleus from bulkRNA sequencing (n = 6) of male mice given ad libitum access to SAAR versus Con diet on day seven. D. Experimental set up and color scheme used in figure 5E–F and figure S5C–D. E. Percent change in body weight (n = 16 – 24) of male mice treated with vehicle (veh) or axitinib via oral gavage in combination with ad libitum access to SAAR versus Con diet after seven days. F. Distance ran during a one-time maximal endurance test (n = 16–24) of male mice treated with veh or axitinib via oral gavage in combination with ad libitum access to SAAR versus Con diet for seven days. G. Representative fluorescence images of IB4 (white) staining in EDL cross-sections of mice fed a Con or SAAR Diet, co-treated with veh or axitinib via oral gavage (scale bar, 400 μm) for seven days (n = 5–8). H. Normalized count values of Vegfb in EDL treated with either veh or axitinib from bulkRNA sequencing (n = 5) of male mice given ad libitum access to SAAR versus Con diet on day seven. I. Normalized count values of Flt1 in EDL treated with either veh or axitinib from bulkRNA sequencing (n = 5) of male mice given ad libitum access to SAAR versus Con diet on day seven. J. Experimental set up and color scheme used in figure 5K – L and figure S5J – K. K. Percent change in body weight (n = 8–10) of male mice treated with IgG or DC101 via i.p. injection every other day in combination with ad libitum access to SAAR versus Con diet after seven days. L. Distance ran during a one-time maximal endurance test (n = 12–16) of male mice treated with IgG or DC101 via i.p injection every other day in combination with ad libitum access to SAAR versus Con diet on day seven. All data is shown as mean and error bars indicate SD unless otherwise noted; p values indicate the significance of the difference by two-way ANOVA with Sidak’s multiple comparisons test between diets and treatment; significance is determined by a p value of p < 0.05. See also Figure S5 and Table S6.

Similar articles

References

    1. Abcouwer S.F., Marjon P.L., Loper R.K., Vander Jagt D.L., 2002. Response of VEGF expression to amino acid deprivation and inducers of endoplasmic reticulum stress. Invest. Ophthalmol. Vis. Sci. 43, 2791–2798. - PubMed
    1. Agius T., Emsley R., Lyon A., MacArthur M.R., Kiesworo K., Faivre A., Stavart L., Lambelet M., Legouis D., De Seigneux S., Golshayan D., Lazeyras F., Yeh H., Markmann J.F., Uygun K., Ocampo A., Mitchell S.J., Allagnat F., Déglise S., Longchamp A., 2024. Short-term hypercaloric carbohydrate loading increases surgical stress resilience by inducing FGF21. Nat. Commun. 15, 1073. 10.1038/s41467-024-44866-3 - DOI - PMC - PubMed
    1. Arany Z., Foo S.-Y., Ma Y., Ruas J.L., Bommi-Reddy A., Girnun G., Cooper M., Laznik D., Chinsomboon J., Rangwala S.M., Baek K.H., Rosenzweig A., Spiegelman B.M., 2008. HIF-independent regulation of VEGF and angiogenesis by the transcriptional coactivator PGC-1α. Nature 451, 1008–1012. 10.1038/nature06613 - DOI - PubMed
    1. Bloor C.M., 2005. Angiogenesis during exercise and training. Angiogenesis 8, 263–271. 10.1007/s10456-005-9013-x - DOI - PubMed
    1. Brooke M.H., Kaiser K.K., 1970. Muscle Fiber Types: How Many and What Kind? Arch. Neurol. 23, 369–379. 10.1001/archneur.1970.00480280083010 - DOI - PubMed

Publication types

LinkOut - more resources