[Preprint]. 2024 Oct 18:2024.06.27.600893.
doi: 10.1101/2024.06.27.600893.

Towards a More Objective and High-throughput Spheroid Invasion Assay Quantification Method

Affiliations

Towards a More Objective and High-throughput Spheroid Invasion Assay Quantification Method

Rozanne W Mungai et al. bioRxiv. .

Update in

Abstract

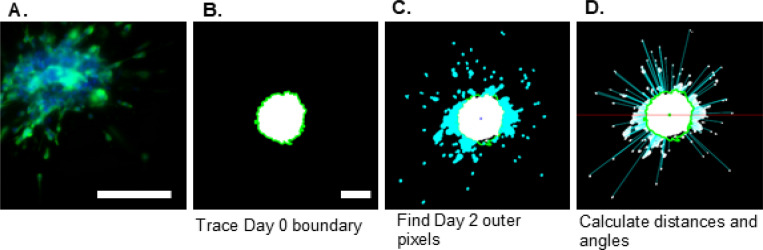
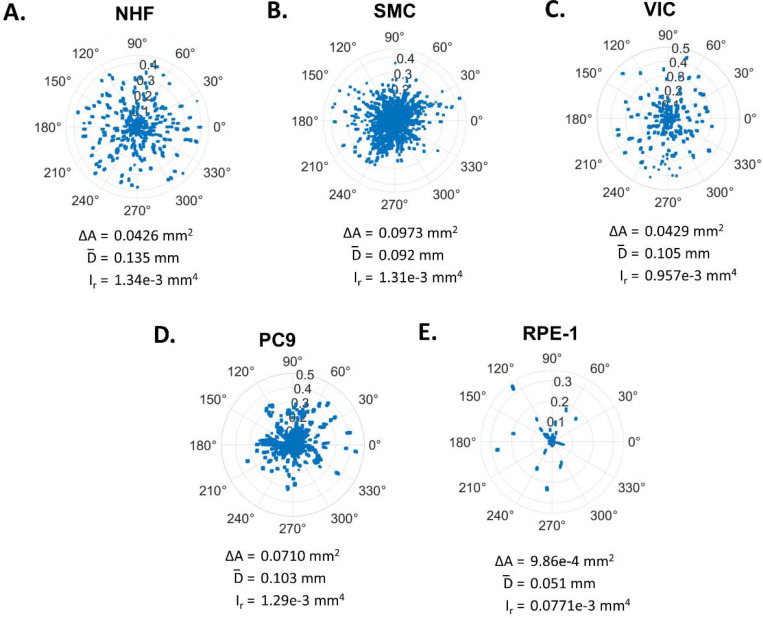
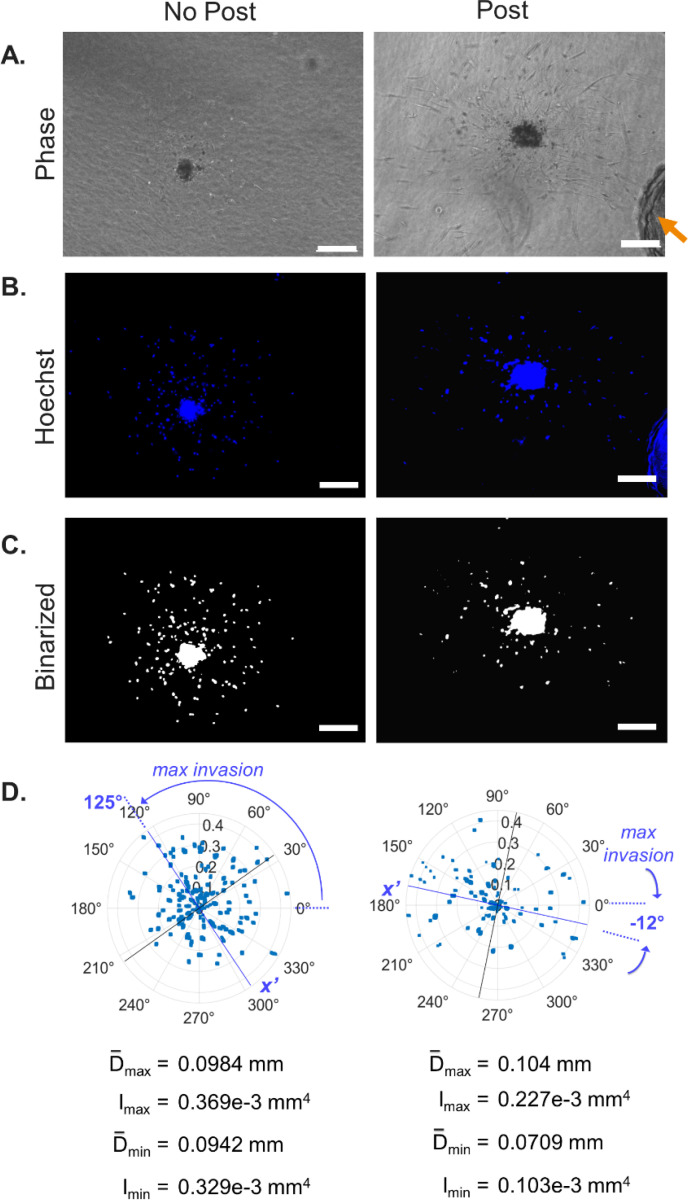
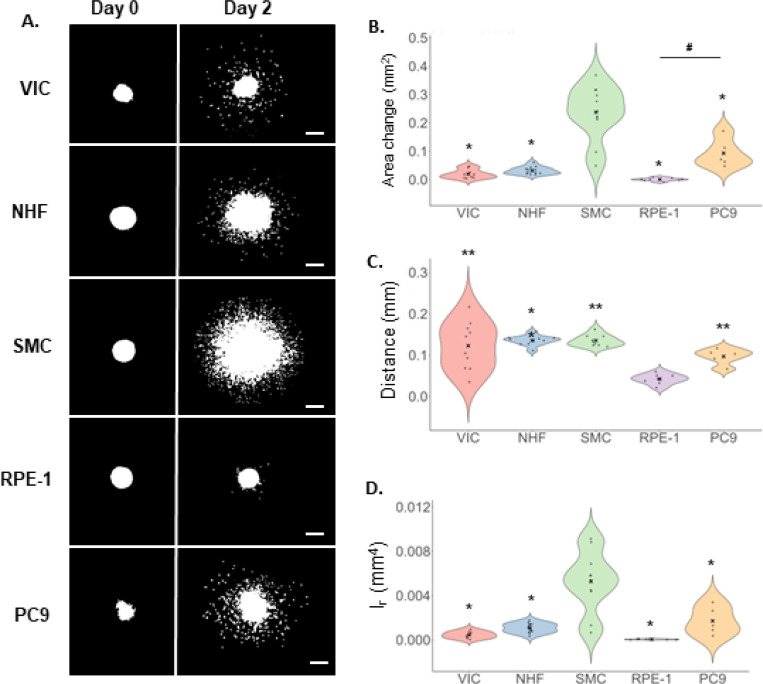
Multicellular spheroids embedded in 3D hydrogels are prominent in vitro models for 3D cell invasion. Yet, quantification methods for spheroid cell invasion that are high throughput, objective and accessible are still lacking. Variations in spheroid sizes and the shapes of the cells within render it difficult to objectively assess invasion extent. The goal of this work is to develop a high-throughput quantification method of cell invasion into 3D matrices that minimizes sensitivity to initial spheroid size and cell spreading and provides precise integrative directionally-dependent metrics of invasion. By analyzing images of fluorescent cell nuclei, invasion metrics are automatically calculated at the pixel level. The initial spheroid boundary is segmented and automated calculations of the nuclear pixel distances from the initial boundary are used to compute common invasion metrics (i.e., the change in invasion area, mean distance) for the same spheroid at a later timepoint. We also introduce the area moment of inertia as an integrative metric of cell invasion that considers the invasion area as well as the pixel distances from the initial spheroid boundary. Further, we show that principal component analysis can be used to quantify the directional influence of a stimuli to invasion (e.g., due to a chemotactic gradient or contact guidance). To demonstrate the power of the analysis for cell types with different invasive potentials and the utility of this method for a variety of biological applications, the method is used to analyze the invasiveness of five different cell types. In all, implementation of this high throughput quantification method results in consistent and objective analysis of 3D multicellular spheroid invasion. We provide the analysis code in both MATLAB and Python languages as well as a GUI for ease of use for researchers with a range of computer programming skills and for applications in a variety of biological research areas such as wound healing and cancer metastasis.


Figures

Figure 1:
Figure 1:. Z-stack image processing and quantification.
Images were processed to create maximum z-projection images from each z-stack as demonstrated by a representative Day 2 image (A). The Day 0 boundary was segmented (B) and the pixels of the Day 2 image located past the boundary were identified (C). The distances and angles of pixels outside of the boundary were calculated with reference to the spheroid boundary and center. For clarity, only a portion of the distance lines are shown (D). Scale bar: 200μm. Panel A: Representative spheroid is imaged at 20X magnification and off-set to highlight invading cells. Panels B-D: 10X magnification.
Figure 2:
Figure 2:. Visualization of variation of invasion behavior.
Polar plots demonstrate invasion behavior of individual spheroids on Day 2. The distance (μm) versus angle is plotted for each pixel past the Day 0 spheroid boundary for an example VIC (A), NHF (B), SMC (C), RPE-1 (D) and PC9 (E) spheroid. The boundary is represented as the plot center (0,0). Invasion metrics for example spheroids, area change, ΔA, mean distance, D¯, radial moment, Ir, as defined in the text, are provided below each plot.
Figure 3:
Figure 3:. Quantification program also assesses invasion directionality.
Directional invasion was demonstrated by imaging a collagen gel-embedded VIC spheroid growing near a structural post (indicated by arrow) of the culture well for four days. Phase, Hoechst-stained and binarized spheroid images on Day 2 (no post control) and Day 4 (spheroid with post). Scale bar: 200 μm (A-C). PCA of quantified data plotted as a polar plot centered at the mean. Principal angles are indicated (blue line: maximum invasion at 125° and −12°; black line: minimum invasion). Polar plot depicts the distance from the boundary (mm) versus angle for each pixel. Mean distances and directional moments along the principal angles were calculated to quantify invasion directionality and are provided below the polar plot (D).
Figure 4:
Figure 4:. Invasion of cells from spheroids into collagen hydrogels.
Representative images of invasion on Day 0 compared to Day 2 (A). Top to bottom: VIC, NHF, SMC, RPE-1 and PC9. Binarized maximum projection images of cell nuclei stained with Hoechst fluorescent dye at 10X magnification. Scale bar: 200 μm. Image quantification results for the area change (B), mean distance (C) and radial area moment of inertia (Ir) (D) for VIC, NHF, SMC, PC9 and RPE-1 cells. Biological replicates are VIC=3, NHF & SMC=2, and RPE-1 & PC9=1. Number of spheroids are indicated by dots on each plot and are: VIC n=9, 10, 8 (A-C respectively), NHF n=12, 10, 13 (A-C respectively), SMC n=11, 9, 10 (A-C respectively), RPE n=8 (all), PC9 n=5 (all). “x” indicates the mean value. Significance at p<0.05 determined by one-way ANOVA with Tukey’s HSD post hoc test (exact p-values provided in Supplementary Table 1). * and ** indicate significant difference to SMC (B) and (D) and RPE-1 (C) respectively while  #  indicates significant difference between the specified groups (B).

Similar articles

References

    1. Butcher J. T. & Markwald R. R. Valvulogenesis: the moving target. Philos Trans R Soc Lond B Biol Sci 362, 1489–1503, doi:10.1098/rstb.2007.2130 (2007). - DOI - PMC - PubMed
    1. Ahuja N., Ostwald P., Bark D. & Garrity D. Biomechanical Cues Direct Valvulogenesis. J Cardiovasc Dev Dis 7, doi:10.3390/jcdd7020018 (2020). - DOI - PMC - PubMed
    1. Elsdale T. & Bard J. Collagen substrata for studies on cell behavior. J Cell Biol 54, 626–637, doi:10.1083/jcb.54.3.626 (1972). - DOI - PMC - PubMed
    1. Singer A. J. & Clark R. A. Cutaneous wound healing. N Engl J Med 341, 738–746, doi:10.1056/nejm199909023411006 (1999). - DOI - PubMed
    1. Grinnell F., Rocha L. B., Iucu C., Rhee S. & Jiang H. Nested collagen matrices: a new model to study migration of human fibroblast populations in three dimensions. Exp Cell Res 312, 86–94, doi:10.1016/j.yexcr.2005.10.001 (2006). - DOI - PubMed

Publication types

LinkOut - more resources