[Preprint]. 2025 Feb 28:2024.07.03.601955.
doi: 10.1101/2024.07.03.601955.

Heuristic energy-based cyclic peptide design

Affiliations

Heuristic energy-based cyclic peptide design

Qiyao Zhu et al. bioRxiv. .

Update in

  • Heuristic energy-based cyclic peptide design.
    Zhu Q, Mulligan VK, Shasha D. Zhu Q, et al. PLoS Comput Biol. 2025 Apr 30;21(4):e1012290. doi: 10.1371/journal.pcbi.1012290. eCollection 2025 Apr. PLoS Comput Biol. 2025. PMID: 40305587 Free PMC article.

Abstract

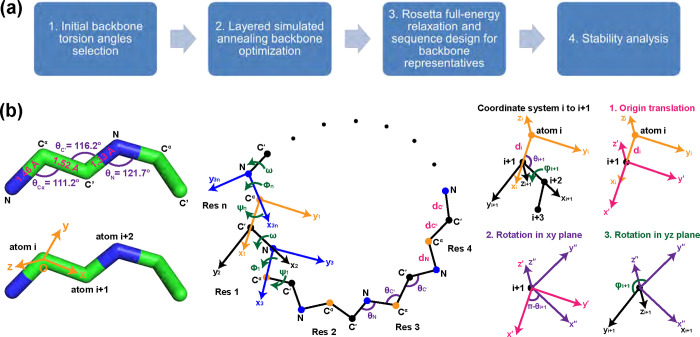
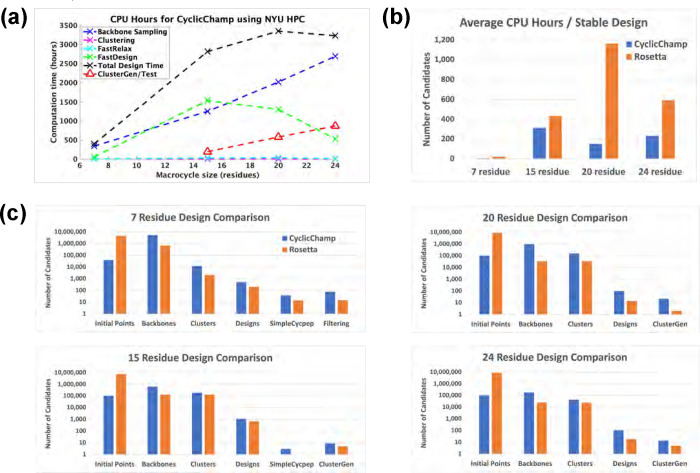
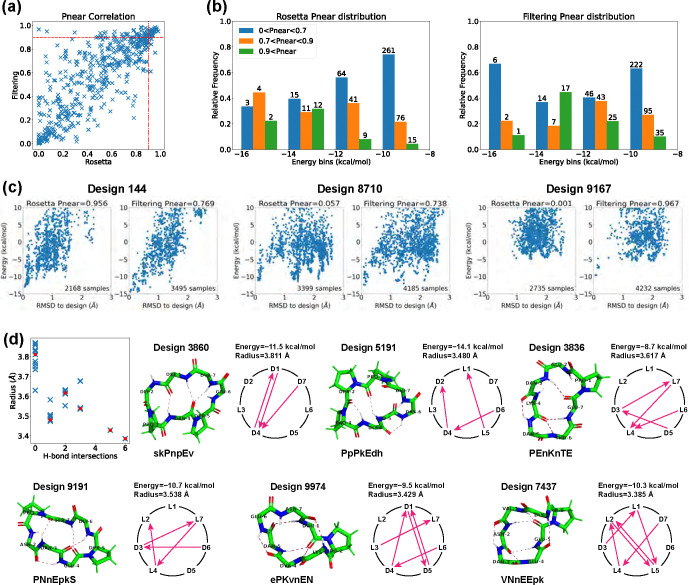
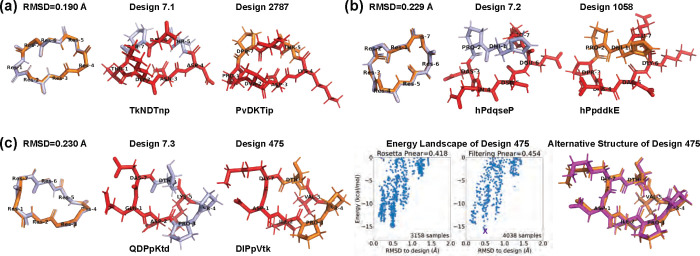
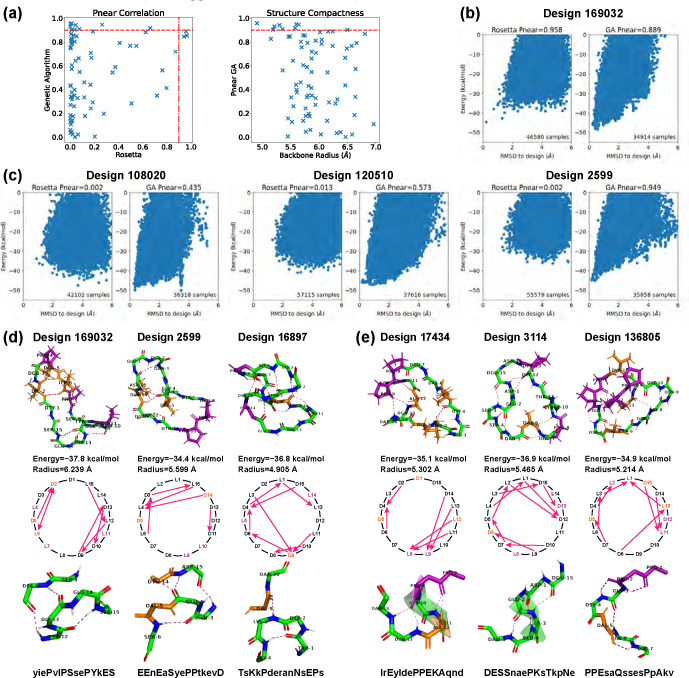
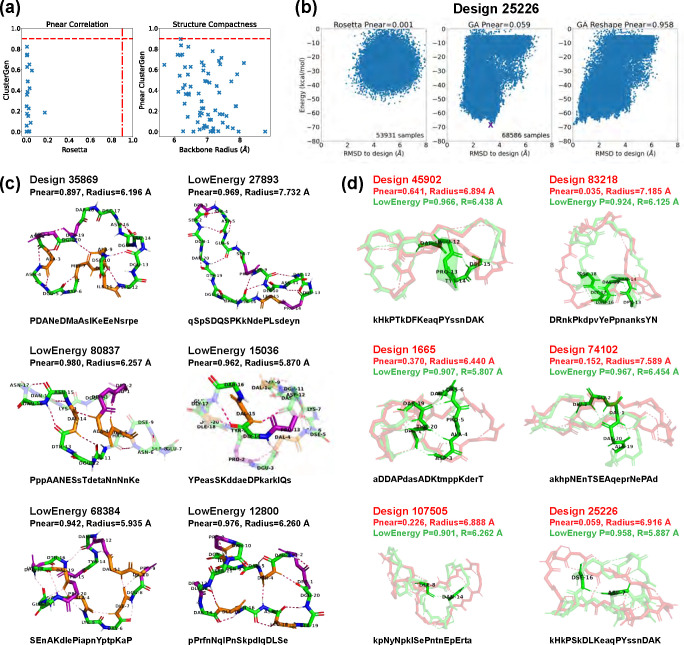
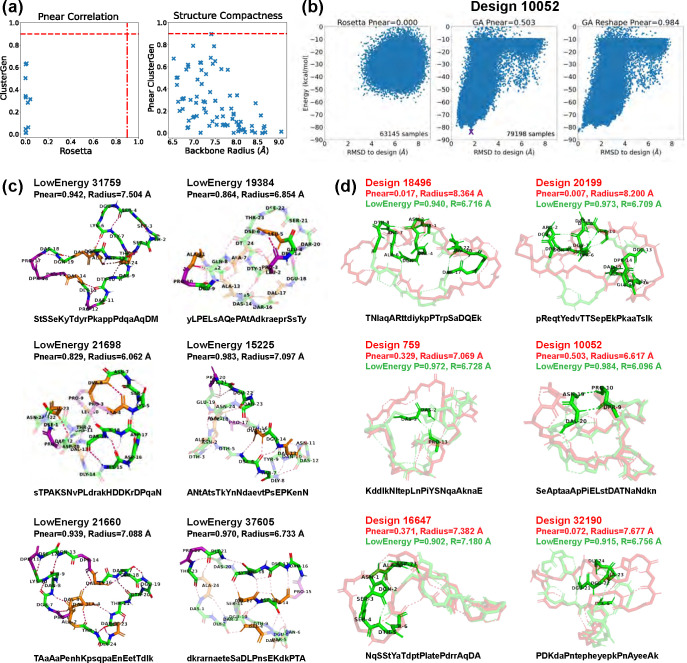
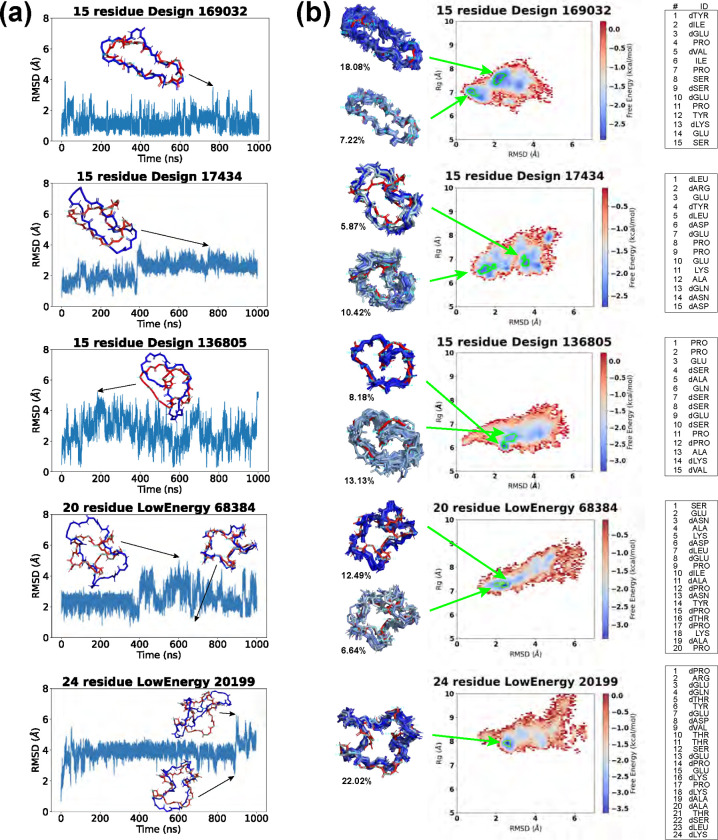
Rational computational design is crucial to the pursuit of novel drugs and therapeutic agents. Meso-scale cyclic peptides, which consist of 7-40 amino acid residues, are of particular interest due to their conformational rigidity, binding specificity, degradation resistance, and potential cell permeability. Because there are few natural cyclic peptides, de novo design involving non-canonical amino acids is a potentially useful goal. Here, we develop an efficient pipeline (CyclicChamp) for cyclic peptide design. After converting the cyclic constraint into an error function, we employ a variant of simulated annealing to search for low-energy peptide backbones while maintaining peptide closure. Compared to the previous random sampling approach, which was capable of sampling conformations of cyclic peptides of up to 14 residues, our method both greatly accelerates the computation speed for sampling conformations of small macrocycles (ca. 7 residues), and addresses the high-dimensionality challenge that large macrocycle designs often encounter. As a result, CyclicChamp makes conformational sampling tractable for 15- to 24-residue cyclic peptides, thus permitting the design of macrocycles in this size range. Microsecond-length molecular dynamics simulations on the resulting 15, 20, and 24 amino acid cyclic designs identify designs with kinetic stability. To test their thermodynamic stability, we perform additional replica exchange molecular dynamics simulations and generate free energy surfaces. Three 15-residue designs, one 20-residue and one 24-residue design emerge as promising candidates.


Figures

Fig 1.
Fig 1.. CyclicChamp workflow and peptide backbone annotations.
(A) There are four steps in CyclicChamp for designing stable cyclic peptides. (B) Ideal backbone bond lengths and bond angles are assumed in CyclicChamp. For backbone closure, we consider local coordinate systems at each atom i. There are three steps transforming from coordinate system i to i+1.
Fig 2.
Fig 2.. CyclicChamp computation time and design comparisons with Rosetta.
(A) The computation time required by CyclicChamp backbone sampling and stability validation (ClusterGen) exhibits linear-like growth with increasing backbone size. FastDesign was faster for 20 and 24 residues than for 15 because there were fewer backbones on which we did sequence design. (B) Total design time divided by the number of stable designs validated by the filtering method for 7 residues, ClusterGen for 15 residues, and reshaped ClusterGen for 20 and 24 residues. (C) When allocating equivalent computation time for backbone sampling, CyclicChamp generated 5 to 28 times as many cyclic backbones with sufficient H-bonds as Rosetta’s simple_cycpep_predict, which led to 2 to 11 times as many stable designs as Rosetta’s after stability validation.
Fig 3.
Fig 3.. Stability analysis of 7-residue designs.
(A) Correlation plot between PNear values calculated by Rosetta simple_cycpep_predict and by our filtering method. (B) PNear value distributions within different energy bins (kcal/mol). Design counts are labeled on top of the bars. (C) Energy landscape comparisons for three cases that have noticeable differences in PNear values calculated by the two methods. Left, more extensive sampling of wells further from the designed state by the filtering method results in a lower computed PNear value. Middle: more extensive sampling close to the designed state by the filtering method identifies a deeper minimum, raising the PNear value. Right: more extensive sampling by the filtering method allows exploration in a low-RMSD region missed entirely by Rosetta, identifying energy wells and raising the PNear value. (D) Top 7-residue designs PNear>0.9 demonstrating smaller backbone root-mean-square radii with H-bond intersections. Representative designs having 0, 1, 2, 3, 5, and 6 H-bond intersections are drawn, along with their H-bond networks where L- and D-amino acids are specified and arrows point from amide proton to carbonyl oxygen. The designed sequences are written in one-letter codes, with uppercase for L-amino acids, and lowercase for D-amino acids.
Fig 4.
Fig 4.. Comparison with Rosetta experimentally validated 7-residue designs [13].
(A,B) From our 513 designs, we find designs (colored in orange) for which the backbones align best with the Rosetta designs (light blue). The residues having different side-chains are marked in red. (C) Design 475 has an alternate low-energy structure (purple), leading to a low PNear value. The amino acid sequences are written in one-letter codes, with uppercase for L-amino acids, and lowercase for D-amino acids.
Fig 5.
Fig 5.. Stability analysis of 15-residue designs.
(A) Correlation plot between PNear values calculated by Rosetta simple_cycpep_predict and by our ClusterGen (left). The PNear values of our ClusterGen are also plotted against the backbone root-mean-square radii (right). (B) Energy landscape comparison for one case in which both methods obtain high PNear values. (C) Energy landscape comparisons for three cases in which the two methods calculate significantly different PNear values. (D) Top designs with bending backbones. The backbone atoms, prolines (in color purple), and hydrophobic amino acids (ALA, ILE, LEU, VAL, MET, PHE in color orange) are shown. The backbone turn segments are enlarged. (E) Top designs with short alpha helices and consecutive i,i+2/i+3 H-bonds. The designed sequences are written in one-letter codes, with uppercase for L-amino acids, and lowercase for D-amino acids.
Fig 6.
Fig 6.. Stability analysis of 20-residue designs.
(A) Correlation plot between PNear values calculated by Rosetta and our ClusterGen (left). The ClusterGen’s PNear values are plotted against the backbone root-mean-square radii (right). (B) Example energy landscape comparison. By selecting the lowest-energy structures (marked by a purple cross) as the native states, the ClusterGen landscapes were reshaped. (C) Six top designs with minor conformation changes between their initial target states and the lowest-energy structures. (D) Six low-energy structures (colored in green) that show major backbone conformation changes from their designed structures (red). These involve formation of a short helix or a compact bending. The amino acid sequences are written in one-letter codes, with uppercase for L-amino acids, and lowercase for D-amino acids.
Fig 7.
Fig 7.. Stability analysis of 24-residue designs.
(A) Correlation plot between PNear values calculated by Rosetta and ClusterGen (left). The ClusterGen’s PNear values are plotted against the backbone root-mean-square radii (right). (B) Example energy landscape comparison. By selecting the lowest energy structures (marked by a purple cross) as the native states, the ClusterGen landscapes were reshaped. (C) Six top designs with minor conformation changes in their low energy structures. (D) Six low energy structures (colored in green) that show major backbone conformation changes from their designed structures (red). The amino acid sequences are written in one-letter codes, with uppercase for L-amino acids, and lowercase for D-amino acids.
Fig 8.
Fig 8.. Molecular dynamics simulation results of top designs.
(A) Backbone Cα-atom RMSDs are calculated between the MD trajectory frames and our designed structures. Snapshots are shown for selected time points (designed structures in red, trajectory frames in blue). (B) REMD free energy surfaces. From the lowest free energy basins (marked by green boundaries), representative structures (colored in blue) are extracted from the histogram bins and aligned against our designed structures (red), with the population percentages in the minima labeled aside. The designed sequences are listed on the side.
Fig 9.
Fig 9.. Structure predictions for macrocycles previously deposited in the PDB.
The best predictions (green) from the low-energy cluster centers are aligned to the PDB structures (orange), with RMSDs shown. PDB structures from the 2017 [13] and 2020 [25] Rosetta design papers are labeled in blue and black, respectively, and all others in pink.

Similar articles

References

    1. Zorzi A, Deyle K, Heinis C. Cyclic peptide therapeutics: past, present and future. Curr Opin Chem Biol. 2017;38:24–29. - PubMed
    1. Vinogradov AA, Yin Y, Suga H. Macrocyclic Peptides as Drug Candidates: Recent Progress and Remaining Challenges. J Am Chem Soc. 2019;141:4167–4181. - PubMed
    1. Mulligan V. The emerging role of computational design in peptide macrocycle drug discovery. Expert Opin Drug Discov. 2020;15:833–852. - PubMed
    1. Joo S. Cyclic peptides as therapeutic agents and biochemical tools. Biomol Ther. 2012;20:19–26. - PMC - PubMed
    1. Mulligan VK, Workman S, Sun T, Rettie S, Li X, Worrall LJ, et al. Computationally designed peptide macrocycle inhibitors of New Delhi metallo-β-lactamase 1. Proc Natl Acad Sci USA. 2021;118:e2012800118. - PMC - PubMed

Publication types