. 2024 May 31;5(6):100994.
doi: 10.1016/j.patter.2024.100994. eCollection 2024 Jun 14.

The receiver operating characteristic curve accurately assesses imbalanced datasets

Affiliations

The receiver operating characteristic curve accurately assesses imbalanced datasets

Eve Richardson et al. Patterns (N Y). .

Abstract

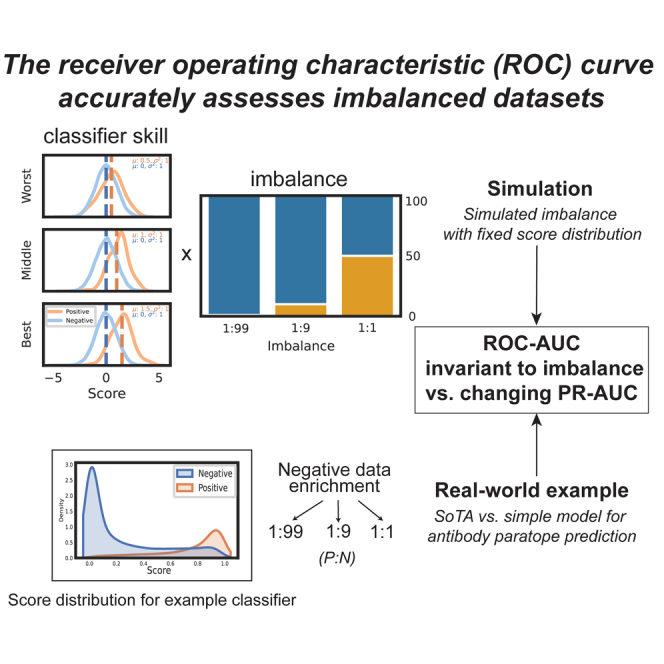
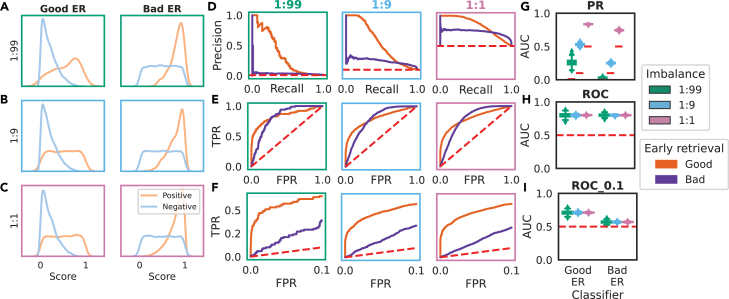
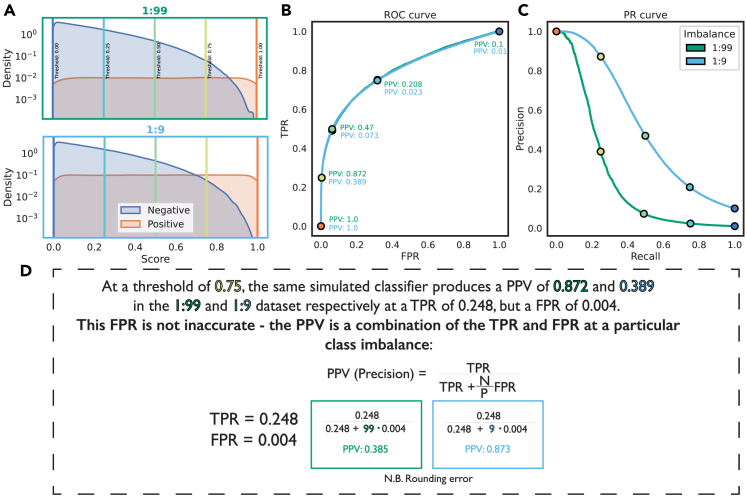
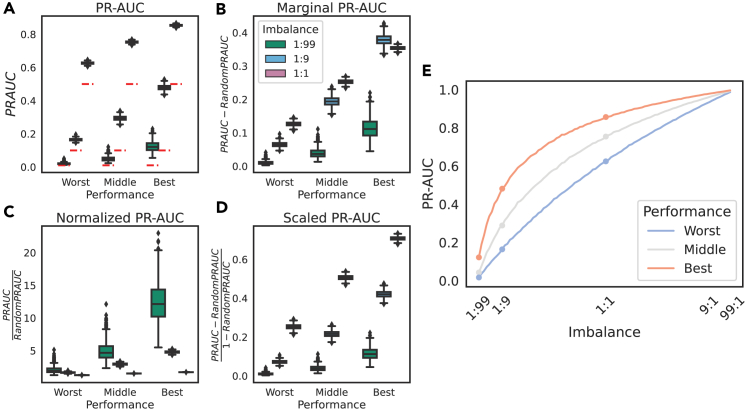
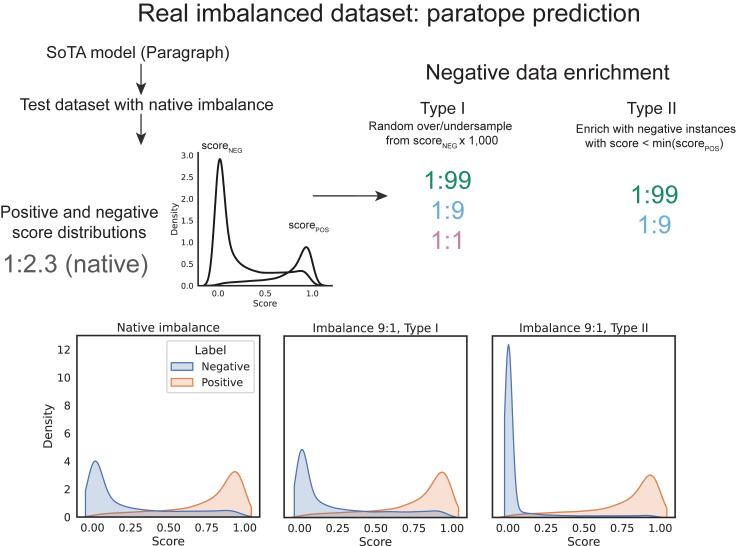
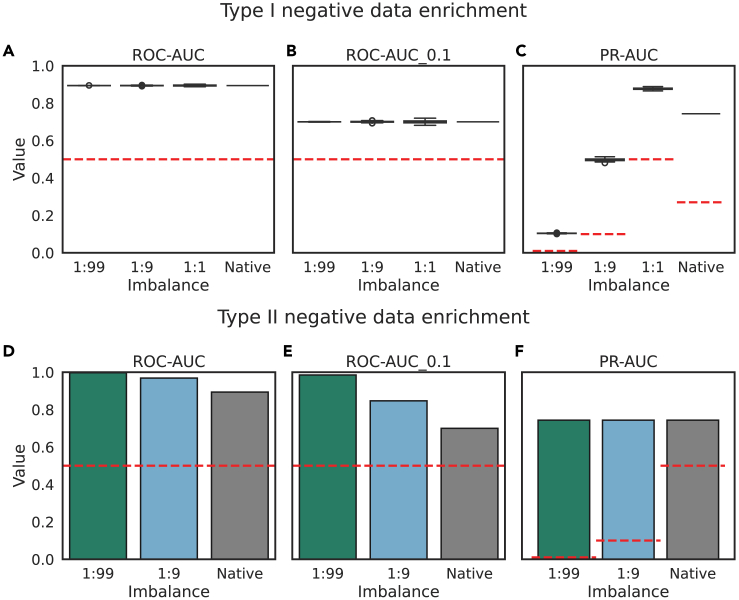
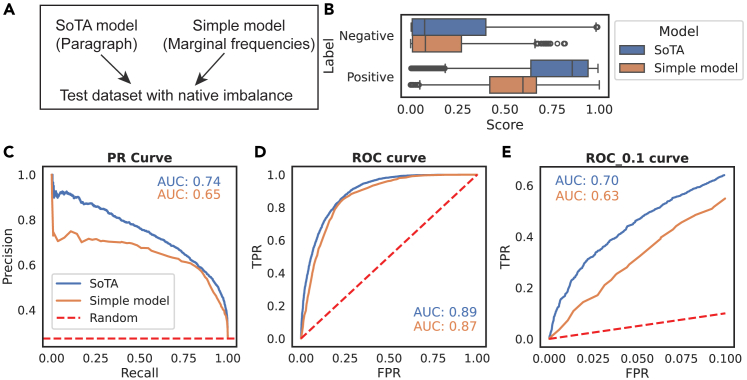
Many problems in biology require looking for a "needle in a haystack," corresponding to a binary classification where there are a few positives within a much larger set of negatives, which is referred to as a class imbalance. The receiver operating characteristic (ROC) curve and the associated area under the curve (AUC) have been reported as ill-suited to evaluate prediction performance on imbalanced problems where there is more interest in performance on the positive minority class, while the precision-recall (PR) curve is preferable. We show via simulation and a real case study that this is a misinterpretation of the difference between the ROC and PR spaces, showing that the ROC curve is robust to class imbalance, while the PR curve is highly sensitive to class imbalance. Furthermore, we show that class imbalance cannot be easily disentangled from classifier performance measured via PR-AUC.

Keywords: ROC curve; binary classification; imbalanced data; machine learning; performance metric; precision-recall.


Conflict of interest statement

The authors declare no competing interests.

Figures

None
Graphical abstract
Figure 1
Figure 1
The ROC and PR curves are calculated from different quadrants of the confusion matrix over multiple operating points (A) For binary classification, a confusion matrix can be calculated for the classifier at a particular operating point (e.g., a score threshold, as shown here). (B) From the confusion matrix, metrics such as precision, TPR (otherwise known as recall or sensitivity) and FPR (which is equal to 1 − specificity) can be calculated. Precision and TPR define the PR space, while TPR and FPR define the ROC space. (C) To produce a PR or ROC curve, these metrics are calculated at multiple operating points. These points can be interpolated, and the areas under the resulting curve can be calculated and compared across classifiers.
Figure 2
Figure 2
Our simulation framework simulates varying classifier performance under different imbalances (A) We simulated three classifier performances defined by the mean centering of the simulated positive scores from “worst” with a positive score distribution centered at 0.5 to “best” with a positive score distribution centered at 1.5. (B) We simulated a dataset size of 10,000 instances with three class imbalances where imbalance is defined as P:N. (C) For each pair of imbalances and classifier types, we calculated PR- and ROC-AUCs. This was repeated 1,000 times.
Figure 3
Figure 3
The PR curve and PR-AUC are highly sensitive to class imbalance, while the ROC curve and ROC-AUC are constant (A–D) The PR curve for each classifier (worst in blue, middle in gray, and best in orange) changes with the underlying class imbalance (A–C), resulting in a changing AUC (D), despite a constant underlying score distribution (Figure S2). (E–H) The ROC curve (E–G) and AUC (H), as well as its random baseline, stay constant with varying imbalance. The curves shown are for a single representative simulation, while the distribution of the PR- and ROC-AUCs across 1,000 simulations at each class imbalance are shown in (D) and (H), respectively. PR-AUC changes drastically with the class imbalance, while the ROC-AUC distribution across simulations is constant. This is a fundamental property of the ROC curve.
Figure 4
Figure 4
ROC-AUC_0.1 can distinguish between classifiers with different ER behavior ROC curves and associated AUCs are calculated across the full threshold range of a classifier by default, which may not be optimal if specifically interested in predictive performance on the positive class. The AUC can instead be calculated over the early retrieval (ER) region, defined in terms of the FPR limit (FPRmax). (A–C) We simulated classifiers with good and bad ER over a range of imbalances. (D–I) For a classifier with good and bad ER behavior, both PR (D) and ROC (E) curves reveal performance differences in the classifier performance. However, while the PR-AUC reveals differing classifier performance in a class imbalance-dependent manner (D), AUC calculation over the full ROC curve cannot distinguish the two classifiers (E), which is why it is recommended not to compare AUCs where ROC curves cross. Simply calculating the AUC up to an FPR below the crossing points reveals the difference between these two classifiers: a partial AUC is calculated from the ROC curve and can be scaled via the McClish correction so that random performance is still equal to 0.5 (F). In contrast to the ROC-AUC (H), this partial AUC can distinguish between the classifiers (I) but is still constant across different class imbalances, unlike the PR-AUC (G).
Figure 5
Figure 5
PPV (precision) can be calculated from the coordinates of the ROC curve with the contribution of FPR weighted by the imbalance (A) Focusing on the good ER classifier shown in Figure 4, the score distributions produced by the same simulation framework for an imbalance of 1:99 and 1:9 are shown normalized to show the different sizes of each subset. (B and C) The resulting ROC curves are identical (B), while the PR curves are drastically different for the same classifier in different imbalances (C). Many practitioners prefer the precision or PPV axis offered by the PR curve (C). (D) We annotate the ROC curve with the corresponding PPVs and their position on the PR curve. There is a striking difference in PPV for points with the same TPR and FPR. This is taken as evidence by some that the ROC curve is “hiding” performance differences; however, no information required to calculate the PPV is hidden in the construction of the ROC curve. PPV is simply a combination of these terms at a particular class imbalance, as described by the formula (proof shown in Proof S1).
Figure 6
Figure 6
Class imbalance cannot be trivially subtracted out from the PR-AUC, as it affects the calculation of the PR-AUC in a classifier-specific manner (A) As per Figure 3, PR-AUC changes drastically with class imbalance. (B–E) We tested three linear transforms of PR-AUC to attempt to account for class imbalance: subtracting the random baseline (class imbalance), marginal PR-AUC (B); dividing PR-AUC by the random baseline, i.e., a fold change, referred to as normalized PR-AUC (C); and min-max scaling of the PR-AUC (D). None can subtract the class imbalance from the AUC. This is because the function of PR-AUC with respect to imbalance is a function of the classifier performance itself (E).
Figure 7
Figure 7
We use a real imbalanced dataset and SoTA model from the domain of antibody paratope prediction to evaluate how imbalance affects performance estimates We use two types of negative data enrichment: type I negative data enrichment follows our simulation where negative data are drawn randomly from the negative score distribution, whereas type II negative data enrichment changes the imbalance by adding negative instances outside of the positive score distribution.
Figure 8
Figure 8
We use a real imbalanced dataset and SoTA model from the domain of antibody paratope prediction to evaluate how imbalance affects performance estimates with two different types of negative data enrichment (A–C) The first strategy emulates our simulations in that the score distribution does not change (Figure 7): as per our simulations, the ROC-AUC and ROC-AUC_0.1 (averaged across repeats) are not affected by drastically increasing or decreasing imbalance (A and B), while the PR-AUC as well as its random baseline (red dashed line) are (C). (D–F) In the type II negative data enrichment, the score distribution is changed so that there are many more negative instances outside of the positive score distribution. This results in changes to the ROC-AUC and ROC-AUC_0.1 (D and E) but does not affect the PR-AUC (F).
Figure 9
Figure 9
Comparison of a SoTA and simple model for paratope prediction in the PR and ROC spaces We looked further into how performance estimates differed for a SoTA model and a simple model on the test dataset (A and B). A larger performance difference is observed for the PR-AUC than the ROC-AUC (C) with a difference of 0.09 vs. 0.02 for the ROC curve (D). This performance difference estimate is not attributable to class imbalance. Rather, it reflects both differing properties about the PR-AUC space and the fact that performance is evaluated only where TPR ≤ 1. For a performance metric focusing on classifier performance in the score range of the positive distribution, we recommend a partial ROC-AUC evaluated up until a selected FPRmax. (E) The SoTA and simple model show a starker difference in the ER area while retaining the invariance to class imbalance of the full ROC curve.

Similar articles

Cited by

References

    1. Gainza P., Sverrisson F., Monti F., Rodolà E., Boscaini D., Bronstein M.M., Correia B.E. Deciphering interaction fingerprints from protein molecular surfaces using geometric deep learning. Nat. Methods. 2020;17:184–192. doi: 10.1038/s41592-019-0666-6. - DOI - PubMed
    1. Williams N.P., Rodrigues C.H.M., Truong J., Ascher D.B., Holien J.K. DockNet: high-throughput protein–protein interface contact prediction. Bioinformatics. 2023;39 doi: 10.1093/bioinformatics/btac797. - DOI - PMC - PubMed
    1. Carter H., Chen S., Isik L., Tyekucheva S., Velculescu V.E., Kinzler K.W., Vogelstein B., Karchin R. Cancer-Specific High-Throughput Annotation of Somatic Mutations: Computational Prediction of Driver Missense Mutations. Cancer Res. 2009;69:6660–6667. doi: 10.1158/0008-5472.CAN-09-1133. - DOI - PMC - PubMed
    1. Sofaer H.R., Hoeting J.A., Jarnevich C.S. The area under the precision-recall curve as a performance metric for rare binary events. Methods Ecol. Evol. 2019;10:565–577. doi: 10.1111/2041-210X.13140. - DOI
    1. Thölke P., Mantilla-Ramos Y.-J., Abdelhedi H., Maschke C., Dehgan A., Harel Y., Kemtur A., Mekki Berrada L., Sahraoui M., Young T., et al. Class imbalance should not throw you off balance: Choosing the right classifiers and performance metrics for brain decoding with imbalanced data. Neuroimage. 2023;277 doi: 10.1016/j.neuroimage.2023.120253. - DOI - PubMed

LinkOut - more resources