. 2024 Jun 15;14(6):3036-3058.
doi: 10.62347/VUJV9180. eCollection 2024.

Prognostic significance of alpha-2-macrglobulin and low-density lipoprotein receptor-related protein-1 in various cancers

Affiliations

Prognostic significance of alpha-2-macrglobulin and low-density lipoprotein receptor-related protein-1 in various cancers

Mateusz Olbromski et al. Am J Cancer Res. .

Abstract

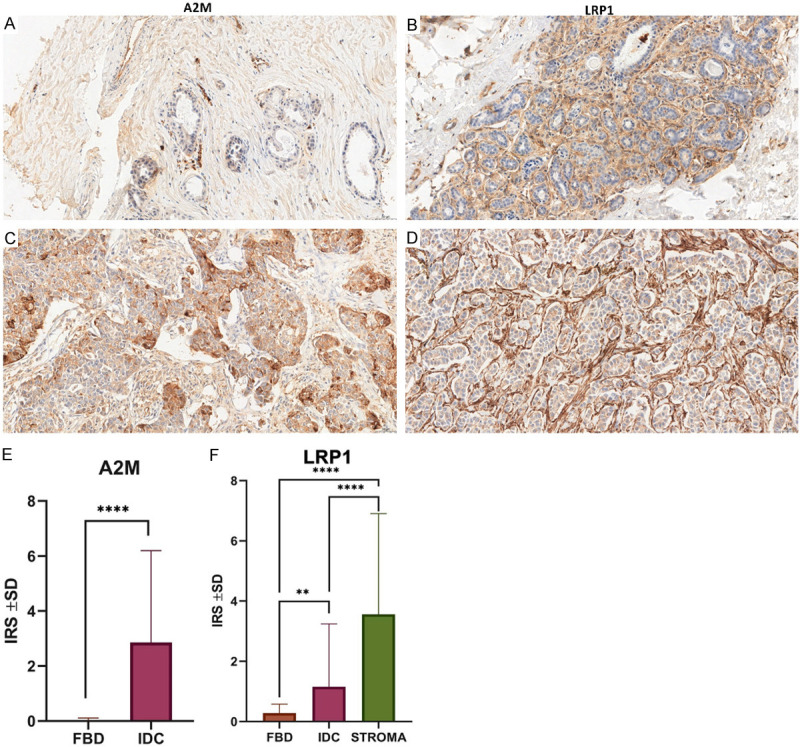
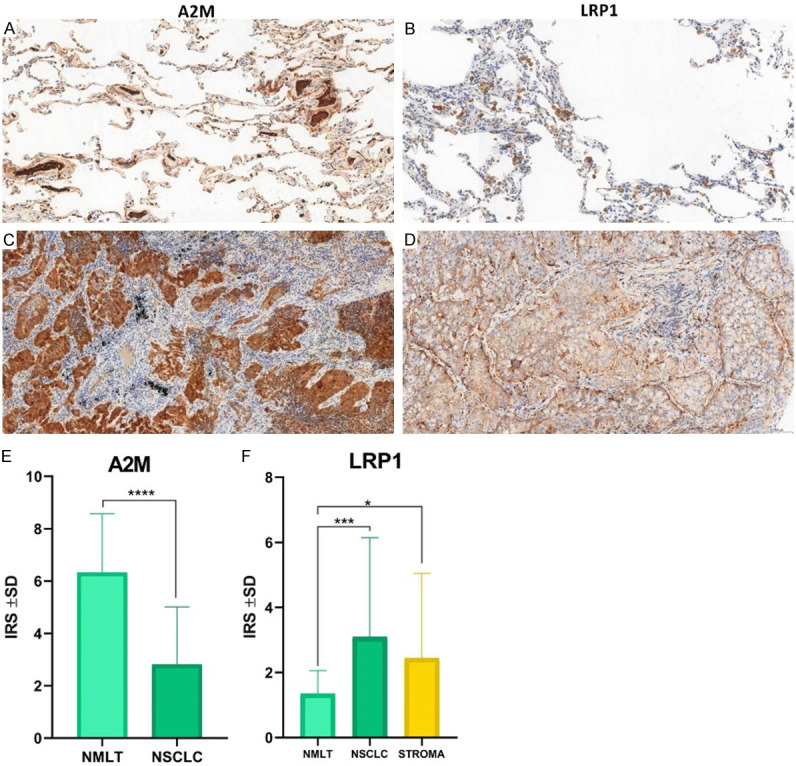
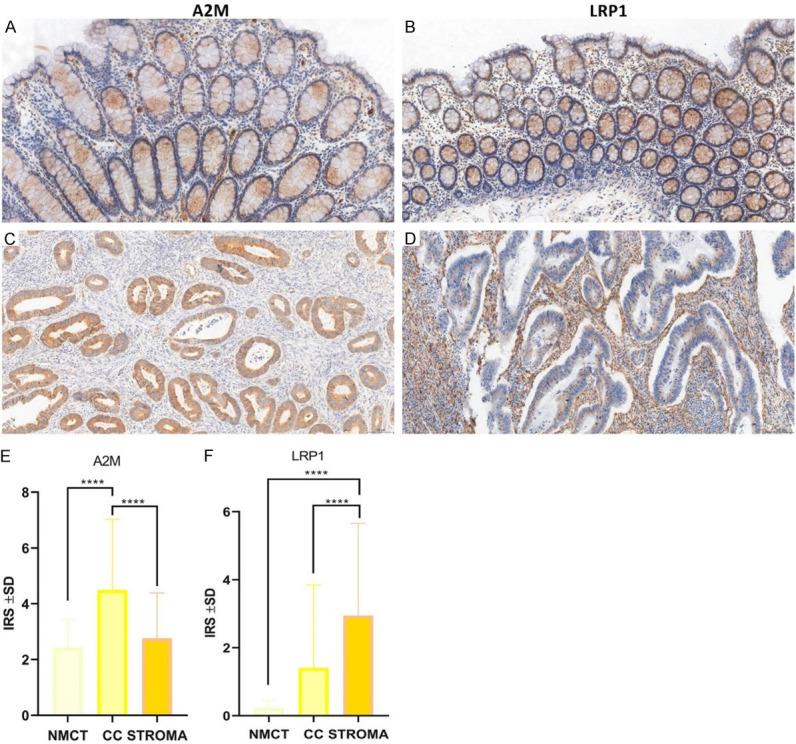
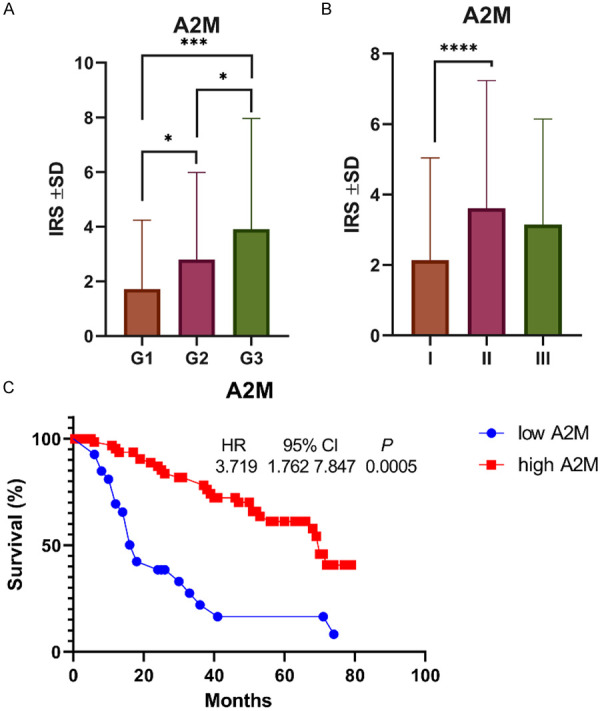
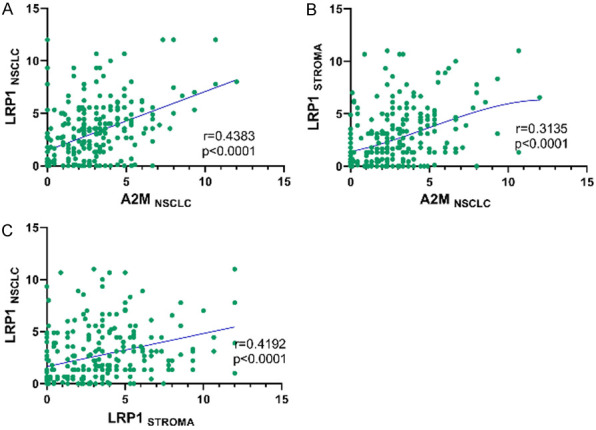
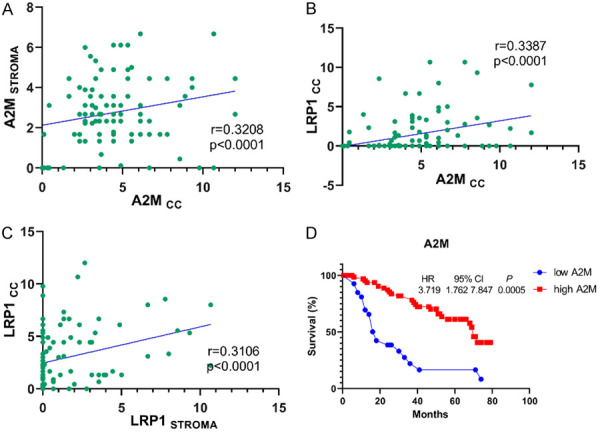
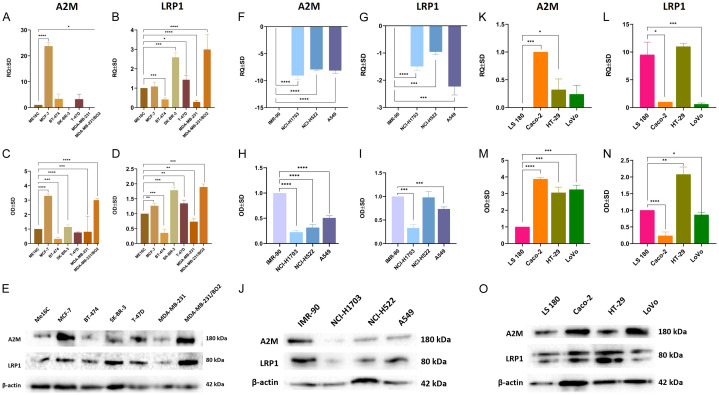
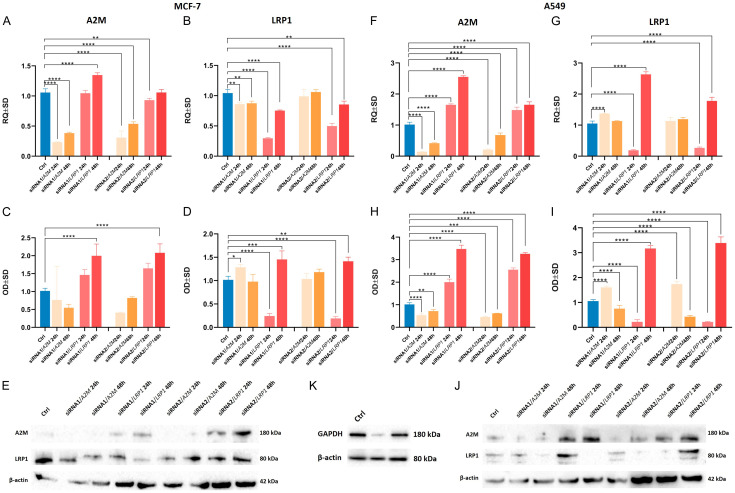
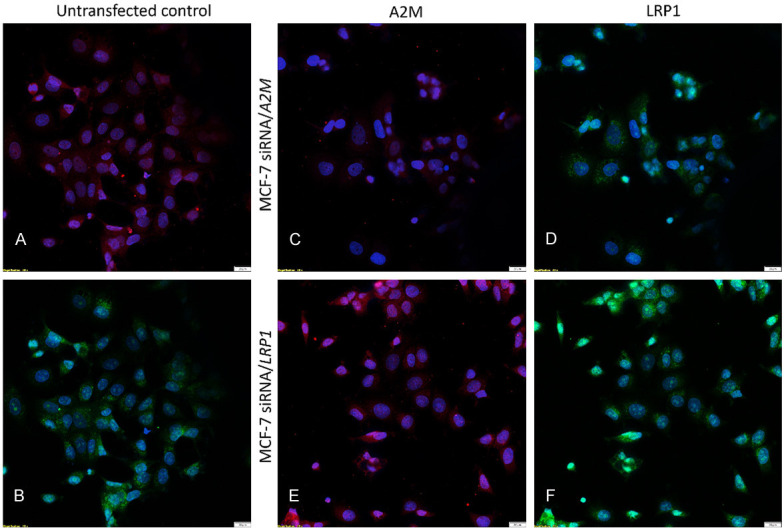
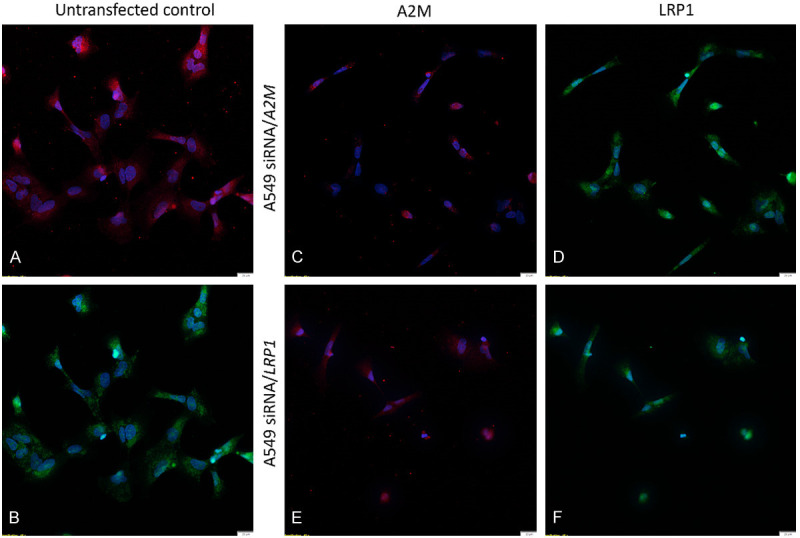
Cancer is the leading cause of death worldwide. The World Health Organization (WHO) estimates that 10 million fatalities occurred in 2023. Breast cancer (BC) ranked first among malignancies with 2.26 million cases, lung cancer (LC) second with 2.21 million cases, and colon and rectum cancers (CC, CRC) third with 1.93 million cases. These results highlight the importance of investigating novel cancer prognoses and anti-cancer markers. In this study, we investigated the potential effects of alpha-2 macroglobulin and its receptor, LRP1, on the outcomes of breast, lung, and colorectal malignancies. Immunohistochemical staining was used to analyze the expression patterns of A2M and LRP1 in 545 cases of invasive ductal breast carcinoma (IDC) and 51 cases of mastopathies/fibrocystic breast disease (FBD); 256 cases of non-small cell lung carcinomas (NSCLCs) and 45 cases of non-malignant lung tissue (NMLT); and 108 cases of CRC and 25 cases of non-malignant colorectal tissue (NMCT). A2M and LRP1 expression levels were also investigated in breast (MCF-7, BT-474, SK-BR-3, T47D, MDA-MB-231, and MDA-MB-231/BO2), lung (NCI-H1703, NCI-H522, and A549), and colon (LS 180, Caco-2, HT-29, and LoVo) cancer cell lines. Based on our findings, A2M and LRP1 exhibited various expression patterns in the examined malignancies, which were related to one another. Additionally, the stroma of lung and colorectal cancer has increased levels of A2M/LRP1 areas, which explains the significance of the stroma in the development and maintenance of tumor homeostasis. A2M expression was shown to be downregulated in all types of malignancies under study and was positively linked with an increase in cell line aggressiveness. Although more invasive cells had higher levels of A2M expression, an IHC analysis showed the opposite results. This might be because exogenous alpha-2-macroglobulin is present, which has an inhibitory effect on several cancerous enzymes and receptor-dependent signaling pathways. Additionally, siRNA-induced suppression of the transcripts for A2M and LRPP1 revealed their connection, which provides fresh information on the function of the LRP1 receptor in A2M recurrence in cancer. Further studies on different forms of cancer may corroborate the fact that both A2M and LRP1 have high potential as innovative therapeutic agents.

Keywords: A2M; Breast cancer; CC; IDC; LRP1; NSCLC; alpha-2-macroglobulin; colorectal cancer; low-density lipoprotein receptor-related protein-1; lung cancer.


Conflict of interest statement

None.

Figures

Figure 1
Figure 1
Differentiated expression patterns of A2M and LRP1 in cancer cells and control tissues. Immunohistochemical analysis of A2M and LRP1 in cancer cells of IDC (C, D) compared to corresponding non-malignant tissues (FBD) (A, B). Original magnification: × 400. Statistical analysis of A2M and LRP1 IHC reactions in FBD (n = 51) and IDC (n = 545) cases. A2M’s significantly higher expression level between IDC and FBD samples (P<0.0001, Mann-Whitney test) (E). LRP1’s membranous expression in FBD and IDC with regard to stroma (F). A significantly higher expression was seen in IDC compared to FBD (P = 0.0027, Mann-Whitney test) and in stroma compared to FBD (P<0.0001, Mann-Whitney test) and IDC (P<0.0001, Mann-Whitney test).
Figure 3
Figure 3
Immunohistochemical analysis of A2M and LRP1 in cancer cells of NSCLC (C, D) compared to corresponding non-malignant lung tissues (NMLT) (A, B). IHC analysis of A2M and LRP1 expression patterns in NMLT (n = 25) and NSCLC (n = 108) cases (E, F). A2M showed significantly higher expression levels in NMLT compared to lung cancer cells (P<0.0001, Mann-Whitney test) (E), while higher LRP1’s membranous expressions were noticed in NSCLC (P = 0.0003, Mann-Whitney test) and stroma (P = 0.0365, Mann-Whitney test) compared to NMLT (F).
Figure 5
Figure 5
Immunohistochemical analysis of A2M and LRP1 in cancer cells of CC (C, D) compared to corresponding non-malignant colon tissues (NMCT) (A, B). IHC analysis of A2M and LRP1 expression patterns in NMCT (n = 45) and NSCLC (n = 256) cases (E, F). Both A2M and LRP1 expression patterns were significantly higher in CC (P<0.0001, Mann-Whitney test) (E) compared to NMCT, and LRP1 was elevated in stroma compared to CC (P<0.0001, Mann-Whitney test) and NMCT (P<0.0001, Mann-Whitney test) (F).
Figure 2
Figure 2
A2M expression in IDC with regard to malignancy grade (A) and TNM staging (B). A significantly higher expression was seen in G2 compared to G1 cases (P = 0.0132, Mann-Whitney test); in G3 compared to G1 (P = 0.0003, Mann-Whitney test) and G2 (P = 0.0146, Mann-Whitney test); and in TNM II compared to TNM I (P = 0.0029, Mann-Whitney test). Survival curve established by data obtained from KM-plot. (C) The survival time of IDC patients with high expression of A2M is higher than that of patients with low expression of A2M (P = 0.0005).
Figure 4
Figure 4
Spearman correlations of (A) A2MNSCLC and LRP1NSCLC (r = 0.4383; P<0.0001); (B) A2MNSCLC and LRP1STROMA (r = 0.3135; P<0.0001); and (C) LRP1STROMA and LRP1NSCLC (r = 0.4192; P<0.0001).
Figure 6
Figure 6
Spearman correlations of (A) A2MCC and A2MSTROMA (r = 0.3208; P<0.0001); (B) A2MCC and LRP1CC (r = 0.3387; P<0.0001); and (C) LRP1STROMA and LRP1CC (r = 0.3106; P<0.0001). (D) The survival time of CC patients with high expression of A2M is higher than that of patients with low expression of A2M (P = 0.0005).
Figure 7
Figure 7
Relative expression levels of A2M and LRP1 in breast cancer cell lines (A, B), lung cancer cell lines (F, G), and colorectal cancer cell lines (K, L). Data are the mean ± SD of triplicate determinants. Western blot analysis of A2M and LRP1 in breast cancer cell lines (C, D), lung cancer cell lines (H, I), and colorectal cancer cell lines (M, N). As an internal control, a β-actin protein was used (E, J, O). Data show the average standard deviation of three independent experiments. *P<0.1; **P<0.01; ***P<0.001; ****P<0.0001.
Figure 8
Figure 8
Relative levels of A2M and LRP1 mRNAs in MCF-7 IDC cell line and A549 NSCLC cell line transfected with siRNAs against A2M and LRP1. Cells were transfected with the siRNAs for A2M and LRP1 and incubated for 24 h and 48 h. Relative expression levels (RQs) of A2M in MCF-7 (A) and A549 (F) cells, and LRP1 mRNA after silencing in MCF-7 (B) and A549 (G) cells. (C and H) show protein expression analysis of A2M, whereas (D and I) show the analysis of LRP1 in MCF-7 and A549 cell lines. Western blot analysis measured the effects of siRNA-mediated knockdown of A2M and LRP1 in MCF-7 (E) and A549 (J) cell lines. GAPDH was used as an internal control (K). Data represent the mean and standard deviation of three independent experiments. Comparisons between groups were done using Student’s t-test: *P<0.1; **P<0.01; ***P<0.001; ****P<0.0001.
Figure 9
Figure 9
Inhibition of gene expression using siRNA transfection. Immunofluorescence staining of A2M and LRP1 proteins in human breast cancer cell line MCF-7 post-transfection. Protein reduction was sustained 48 h post-siRNA transfection. A2M was immunostained red, LRP1 was immunostained green, and nuclei were stained with DAPI (blue). Untransfected control labeled with A2M (A) and LRP1 (B) antibodies. MCF-7 siRNA/A2M cell line stained with A2M (C) and LRP1 (D). MCF-7 siRNA/LRP1 cell line stained with A2M (E) and LRP1 (F).
Figure 10
Figure 10
Inhibition of gene expression using siRNA transfection. Immunofluorescence staining of A2M and LRP1 proteins in human lung cancer cell line A549 post-transfection. Protein reduction was sustained 48 h post-siRNA transfection. A2M was immunostained red, LRP1 was immunostained green, and nuclei were stained with DAPI (blue). Untransfected control labeled with A2M (A) and LRP1 (B) antibodies. A549 siRNA/A2M cell line stained with A2M (C) and LRP1 (D). A549 siRNA/LRP1 cell line stained with A2M (E) and LRP1 (F).

Similar articles

Cited by

References

    1. Heim D, Budczies J, Stenzinger A, Treue D, Hufnagl P, Denkert C, Dietel M, Klauschen F. Cancer beyond organ and tissue specificity: next-generation-sequencing gene mutation data reveal complex genetic similarities across major cancers. Int J Cancer. 2014;135:2362–2369. - PubMed
    1. Newton Y, Novak AM, Swatloski T, McColl DC, Chopra S, Graim K, Weinstein AS, Baertsch R, Salama SR, Ellrott K, Chopra M, Goldstein TC, Haussler D, Morozova O, Stuart JM. TumorMap: exploring the molecular similarities of cancer samples in an interactive portal. Cancer Res. 2017;77:e111–e114. - PMC - PubMed
    1. Yang X, Sun X. Meta-analysis of several gene lists for distinct types of cancer: a simple way to reveal common prognostic markers. BMC Bioinformatics. 2007;8:118. - PMC - PubMed
    1. Lu Y, Yi Y, Liu P, Wen W, James M, Wang D, You M. Common human cancer genes discovered by integrated gene-expression analysis. PLoS One. 2007;2:e1149. - PMC - PubMed
    1. Repana D, Nulsen J, Dressler L, Bortolomeazzi M, Venkata SK, Tourna A, Yakovleva A, Palmieri T, Ciccarelli FD. The Network of Cancer Genes (NCG): a comprehensive catalogue of known and candidate cancer genes from cancer sequencing screens. Genome Biol. 2019;20:1. - PMC - PubMed

LinkOut - more resources