. 2024 Jun 17;15(14):4513-4526.
doi: 10.7150/jca.97374. eCollection 2024.

Identification of Hypoxia and Mitochondrial-related Gene Signature and Prediction of Prognostic Model in Lung Adenocarcinoma

Affiliations

Identification of Hypoxia and Mitochondrial-related Gene Signature and Prediction of Prognostic Model in Lung Adenocarcinoma

Wenhao Zhao et al. J Cancer. .

Abstract

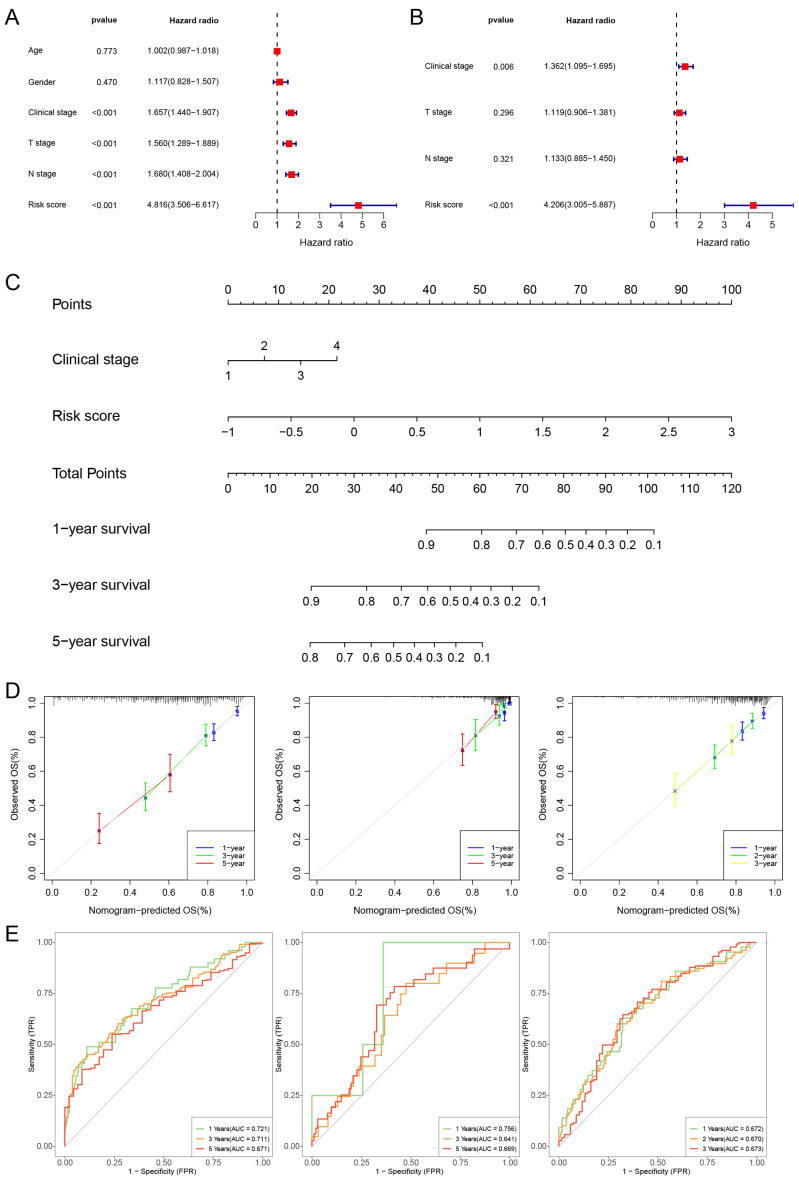
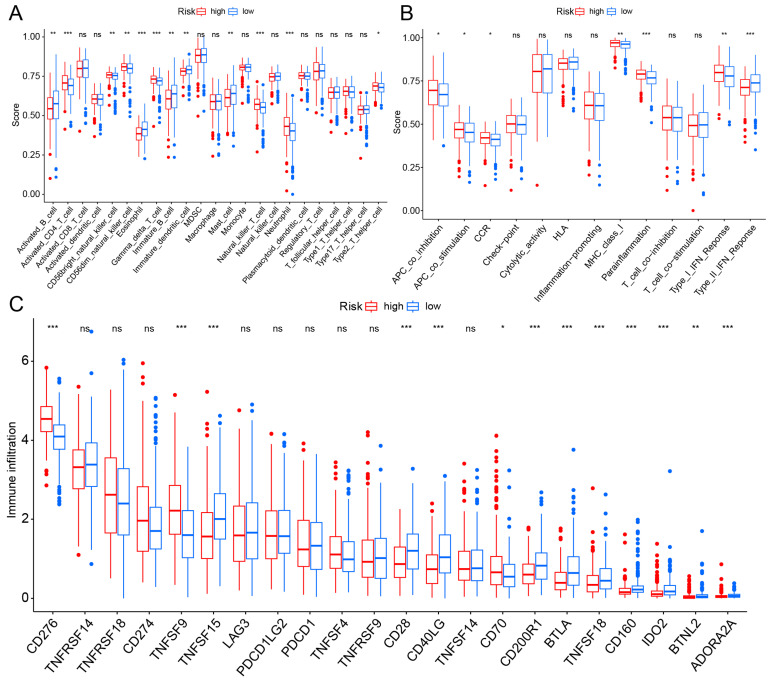
Background: The correlation between hypoxia and tumor development is widely acknowledged. Meanwhile, the foremost organelle affected by hypoxia is mitochondria. This study aims to determine whether they possess prognostic characteristics in lung adenocarcinoma (LUAD). For this purpose, a bioinformatics analysis was conducted to assess hypoxia and mitochondrial scores related genes, resulting in the successful establishment of a prognostic model. Methods: Using the single sample Gene Set Enrichment Analysis algorithm, the hypoxia and mitochondrial scores were computed. Differential expression analysis and weighted correlation network analysis were employed to identify genes associated with hypoxia and mitochondrial scores. Prognosis-related genes were obtained through univariate Cox regression, followed by the establishment of a prognostic model using least absolute shrinkage and selection operator Cox regression. Two independent validation datasets were utilized to verify the accuracy of the prognostic model using receiver operating characteristic and calibration curves. Additionally, a nomogram was employed to illustrate the clinical significance of this study. Results: 318 differentially expressed genes associated with hypoxia and mitochondrial scores were identified for the construction of a prognostic model. The prognostic model based on 16 genes, including PKM, S100A16, RRAS, TUBA4A, PKP3, KCTD12, LPGAT1, ITPRID2, MZT2A, LIFR, PTPRM, LATS2, PDIK1L, GORAB, PCDH7, and CPED1, demonstrates good predictive accuracy for LUAD prognosis. Furthermore, tumor microenvironments analysis and drug sensitivity analysis indicate an association between risk scores and certain immune cells, and a higher risk scores suggesting improved chemotherapy efficacy. Conclusion: The research established a prognostic model consisting of 16 genes, and a nomogram was developed to accurately predict the prognosis of LUAD patients. These findings may contribute to guiding clinical decision-making and treatment selection for patients with LUAD, ultimately leading to improved treatment outcomes.

Keywords: hypoxia; immune; lung adenocarcinoma; mitochondrial; prognosis..


Conflict of interest statement

Competing Interests: The authors have declared that no competing interest exists.

Figures

Figure 1
Figure 1
Coexpression Network Construction. (A) The network topology analysis was conducted using various soft threshold powers. (B) Cluster dendrograms of genes based on topological overlap of dissimilarities, and module colors were assigned. (C) Heatmap illustrates the relationship between gene modules and phenotypic traits. The correlation coefficient in each cell reflects this relationship, transitioning from red to blue to indicate decreasing magnitude. The number in parentheses within each cell denotes the correlation P-value.
Figure 2
Figure 2
Obtaining and Enrichment analysis for the hypoxia and mitochondrial score related DEGs. (A) Volcano plot showing the DEGs in hub genes between tumor and normal. (B) Venn diagrams showing overlaps of overexpressed genes and hub genes (red: overexpressed genes in tumor samples; blue: overexpressed genes in normal samples). (C) The enriched gene terms in gene set enrichment analysis (GSEA). (D) Column diagrams depicting GO analysis for DEGs related to hypoxia and mitochondrial scores. (E) Column diagrams depicting KEGG analysis for DEGs related to hypoxia and mitochondrial scores.
Figure 3
Figure 3
Construction of a hypoxia and mitochondrial score related prognostic model. (A, B) Determining the number of factors using LASSO analysis. (C) Heatmap displaying 16 model genes and clinical features. (D) Distribution of risk score according to the survival status and time in TCGA, GSE31210, and GSE72094 cohorts. (E) Kaplan-Meier curves depicting OS for patients in the different groups.
Figure 4
Figure 4
Unsupervised clustering of hypoxia and mitochondrial score related model genes. (A) LUAD patients were grouped into two molecular clusters using a k = 2 approach, relying on the hypoxia and mitochondrial score-related model gene profile. (B) Plotting the empirical cumulative distribution function, we observed consensus distributions for each k value ranging from 2 to 9. (C) Kaplan-Meier analysis of the prognosis of LUAD patients across two distinct molecular clusters. (D) Alluvial diagram illustrates the interrelation among molecular clusters, survival status, and risk groups in LUAD patients.
Figure 5
Figure 5
Constructing a nomogram diagram. (A, B) The univariate and multivariate Cox regression analysis of risk score and clinical features. (C) Nomogram of risk score and clinical characteristics (D) Nomogram calibration at 1-, 3-, and 5-years in the TCGA cohort, the GSE31210 cohort, and at 1-, 2-, and 3-years in the GSE72094 cohort. (E) The ROC curve shows the accuracy of the prognostic model.
Figure 6
Figure 6
TME and checkpoint analysis. (A) The distribution of 23 immune cell subsets infiltration between two groups. (B) The distribution of 13 immune related pathways between two groups. (C) The distribution of checkpoint related genes between two groups. *p < 0.05, **p < 0.01, ***p < 0.001.
Figure 7
Figure 7
Investigating the correlation between the prognostic model and immunotherapy. (A) The distribution of TMB between two groups. (B) Kaplan-Meier curves depicting OS for patients in the high and low TMB groups. (C) Kaplan-Meier curves illustrate the OS of patients in the combined risk group and TMB group. (D,E) The waterfall plot displays the top 20 mutated genes and their distributional variance in tow groups.
Figure 8
Figure 8
Efficacy of the prognostic model in predicting drug sensitivity. (A) The relationship between drugs, risk score, and model genes; *p < 0.05, **p < 0.01, ***p < 0.001. (B) Boxplots compare the IC50 of drugs between the high-risk and low-risk groups, alongside the correlation between IC50 and risk score.

Similar articles

Cited by

References

    1. Denisenko TV, Budkevich IN, Zhivotovsky B. Cell death-based treatment of lung adenocarcinoma. Cell Death Dis. 2018;9:117. - PMC - PubMed
    1. Schodel J, Grampp S, Maher ER, Moch H, Ratcliffe PJ, Russo P. et al. Hypoxia, Hypoxia-inducible Transcription Factors, and Renal Cancer. Eur Urol. 2016;69:646–57. - PMC - PubMed
    1. Shao C, Yang F, Miao S, Liu W, Wang C, Shu Y. et al. Role of hypoxia-induced exosomes in tumor biology. Mol Cancer. 2018;17:120. - PMC - PubMed
    1. Harris AL. Hypoxia-a key regulatory factor in tumour growth. Nat Rev Cancer. 2002;2:38–47. - PubMed
    1. Lu X, Kang Y. Hypoxia and hypoxia-inducible factors: master regulators of metastasis. Clin Cancer Res. 2010;16:5928–35. - PMC - PubMed

LinkOut - more resources