. 2024 Jul 2;15(14):4668-4685.
doi: 10.7150/jca.97437. eCollection 2024.

DPF2 overexpression correlates with immune infiltration and dismal prognosis in hepatocellular carcinoma

Affiliations

DPF2 overexpression correlates with immune infiltration and dismal prognosis in hepatocellular carcinoma

Kejian Yang et al. J Cancer. .

Abstract

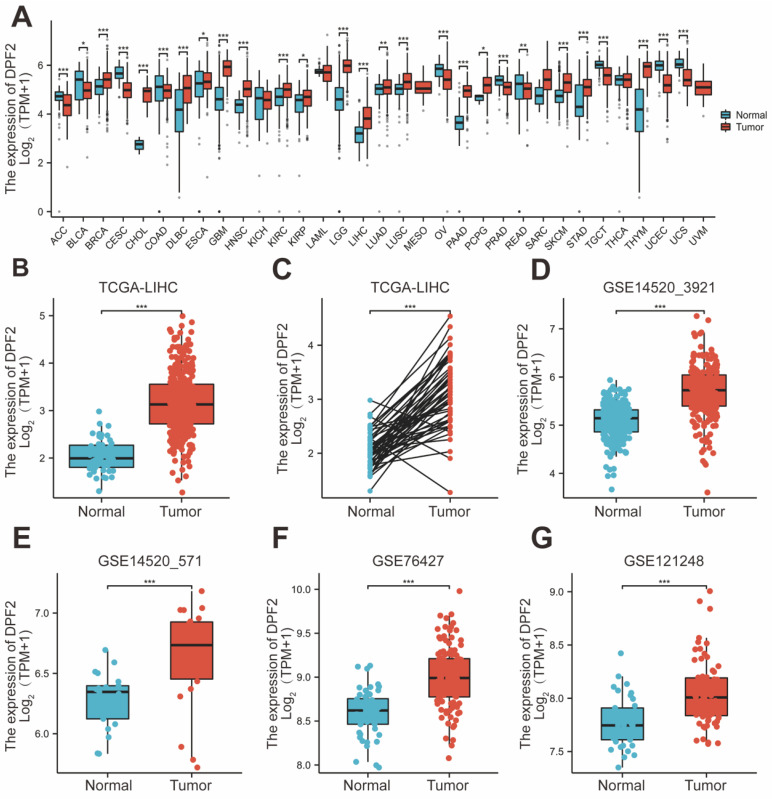
Background: Double plant homeodomain finger 2 (DPF2), belonging to the d4 family of structural domains, has been associated with various human malignancies. However, its impact on hepatocellular carcinoma (HCC) remains unclear. The objective of this study is to elucidate the role of DPF2 in the diagnosis and prognosis of HCC. Methods: DPF2 gene expression in HCC and adjacent tissues was analyzed using Gene Expression Omnibus (GEO) and The Cancer Genome Atlas (TCGA) databases, validated by immunohistochemical staining of Guangxi specimens and data from the Human Protein Atlas (HPA). Gene Ontology (GO), Kyoto Encyclopedia of Genes and Genome (KEGG), and Gene Set Enrichment Analysis (GSEA) were used to identify DPF2's potential pathways and functions in HCC. DPF2's mutation and methylation statuses were assessed via cBioPortal and MethSurv. The association between DPF2 and immune infiltration was investigated by TIMER. The prognostic value of DPF2 in HCC was established through Kaplan-Meier and Cox regression analyses. Results: DPF2 levels were significantly higher in HCC than normal tissues (p<0.001), correlating with more severe HCC features (p<0.05). Higher DPF2 expression predicted poorer overall survival (OS), disease-specific survival (DSS), and progression-free interval (PFI). DPF2 involvement was noted in critical signaling pathways including the cell cycle and Wnt. It also correlated with T helper cells, Th2 cells, and immune checkpoints like CTLA-4, PD-1, and PD-L1. Conclusion: High DPF2 expression, associated with poor HCC prognosis, may disrupt tumor immune balance and promote immune evasion. DPF2 could potentially be utilized as a biomarker for diagnosing and prognosticating hepatocellular carcinoma.

Keywords: DPF2; hepatocellular carcinoma (HCC); immune infiltration; tumor prognosis.


Conflict of interest statement

Competing Interests: The authors have declared that no competing interest exists.

Figures

Figure 1
Figure 1
Expression of DPF2 in different types of tumors and liver cancer. (A) Pan-cancer analysis of DPF2 in TCGA and GTEx databases. (B) TCGA database of HCC and unpaired normal liver tissues. (C) TCGA database of HCC and paired normal liver tissues. (D) GSE14520_3921. (E) GSE14520_571. (F) GSE76427. (G) GSE121248. TCGA, The Cancer Genome Atlas; GTEx, Genotype Tissue Expression Project. ns: p ≥ 0.05; *p < 0.05; **p < 0.01; ***p < 0.001.
Figure 2
Figure 2
Expression of DPF2 at the protein level and relationship between DPF2 and clinicopathological features. (A) Typical immunohistochemical images of DPF2 expression in HCC tissues and normal liver tissues from the HPA database. (B) DPF2 protein expression in HCC tissues and normal liver tissues from the CPTAC database in the UALCAN website. (C) Pathological stage. (D) T stage. (E) Histologic grade. (F) Tumor status. (G) Vascular invasion. (H) AFP. AFP, alpha-fetoprotein. ns: p ≥ 0.05; *p < 0.05; **p < 0.01; ***p < 0.001.
Figure 3
Figure 3
High expression of DPF2 was associated with poor prognosis. Kaplan-Meier survival curves of DPF2 in (A) OS, (B) DSS and (C) PFI in The Cancer Genome Atlas (TCGA), (D) OS and (E) RFS in GSE14520_3921, (F) OS and (G) RFS in GSE14520_571 subgroups. OS, Overall Survival. DSS, Disease Free Survival. PFI: Progression Free Interval. RFS, Recurrence Free Survival.
Figure 4
Figure 4
Predictive ability of DPF2 for hepatocellular carcinoma (HCC). Diagnostic ROC curves in (A) The Cancer Genome Atlas (TCGA), (B) GSE14520_3921, (C) GSE14520_571. (D) Risk score, survival time distribution, and gene expression heat map of DPF2 in TCGA. Predictive power of DPF2 for 1-, 3-, and 5-year overall survival (OS) by time-dependent ROC analysis in (E) TCGA, and (F) GSE14520_3921. (G) Forest map based on Univariate Cox analysis for overall survival. (H) Forest map based on Multivariate Cox analysis for overall survival. (I) Prediction of 1-, 3-, and 5-year OS by nomogram. (J) Calibration plots were used to validate the nomogram model.
Figure 5
Figure 5
Analysis of differentially expressed genes and functional enrichment of DPF2 in HCC. (A) Volcano plot showing the DEGs between DPF2 high and DPF2 low groups. (B) Heat map showing the top five upregulated and downregulated genes with DPF2 expression. (C) Bubble plot of GO and KEGG enrichment analysis. (D) Circle diagram showing the GO and KEGG terms corresponding to the DEGs. (E-F) Enrichment results of GSEA gene set in DPF2 high expression group. (G-H) Enrichment results of GSEA gene set in the DPF2 low expression group. GO:Gene Ontology; KEGG: Kyoto Encyclopedia of Genes and Genomes. ns: p ≥ 0.05; *p < 0.05; **p < 0.01; ***p < 0.001.
Figure 6
Figure 6
DPF2-related genes and their functional analysis. (A) PPI network of DPF2-related genes. (B) Annotation and correlation coefficients of 15 DPF2-related genes. (C) Expression of DPF2-related genes in HCC. (D) Correlation between DPF2 and related genes. (E) GO/KEGG functional enrichment analysis of DPF2-related genes. ns: p ≥ 0.05; *p < 0.05; **p < 0.01; ***p < 0.001.
Figure 7
Figure 7
Correlation of DPF2 with related genes in ferroptosis pathway. (A) GeneMANIA Gene Interaction Network related to DPF2. (B) Heat map of the correlation between DPF2 expression and ferroptosis-related genes. (C-E) Expression of ferroptosis-related genes in the high and low DPF2 expression groups. ns: p ≥ 0.05; *p < 0.05; **p < 0.01; ***p < 0.001.
Figure 8
Figure 8
Mutations and DNA methylation levels of DPF2 and their impact on the prognosis of HCC. (A-B) Mutation levels of the DPF2 in cBioPortal OncoPrint.(C) Association between DPF2 gene mutation and overall survival (OS) in HCC. (D) Association between DPF2 gene mutation and disease-free survival (DFS) in HCC. (E) DPF2 methylation levels in HCC form the UALCAN database. (F) Correlation between DPF2 mRNA expression level and methylation level form the MethSurv database. (G) Correlation between DPF2 methylation level and prognosis of HCC. Kaplan-Meier survival curve of DPF2 in (H) cg02186298, (I) cg02574952, (J) cg06382930.
Figure 9
Figure 9
Correlation of DPF2 expression with immune infiltration and immune checkpoints. (A) Correlation of DPF2 in TIMER with tumor purity and immune cell infiltration status. (B) Bubble plot of the correlation between DPF2 and 24 immune cells. (C) Degree of immune infiltration of different immune cells in high and low DPF2 expression. Scatter plots of correlation between DPF2 expression levels and (D) T helper cells, (E) Th2 cells, (F) DCs and (G) cytotoxic cells. Scatter plots of correlation between DPF2 expression levels and (H) TP53, (I) CTLA-4, (J) PD-1 and (K) PD-L1. ns: p ≥ 0.05; *p < 0.05; **p < 0.01; ***p < 0.001.
Figure 10
Figure 10
Validation of DPF2 protein expression in Guangxi patients with hepatocellular carcinoma. (A) Representative immunohistochemical (IHC) images of DPF2 expression in HCC and adjacent liver tissues. (B-C) Average optical density (AOD) of immunohistochemical staining of DPF2 in HCC and adjacent liver tissues. ****p < 0.0001.

Similar articles

Cited by

References

    1. Sung H, Ferlay J, Siegel RL, Laversanne M, Soerjomataram I, Jemal A. et al. Global Cancer Statistics 2020: GLOBOCAN Estimates of Incidence and Mortality Worldwide for 36 Cancers in 185 Countries. CA Cancer J Clin. 2021;71:209–49. - PubMed
    1. Chhikara BS, Parang K. Global Cancer Statistics 2022: the trends projection analysis. Chemical Biology Letters. 2023;10:451. -
    1. Zhang C-H, Cheng Y, Zhang S, Fan J, Gao Q. Changing epidemiology of hepatocellular carcinoma in Asia. Liver Int. 2022;42:2029–41. - PubMed
    1. Cao W, Chen H-D, Yu Y-W, Li N, Chen W-Q. Changing profiles of cancer burden worldwide and in China: a secondary analysis of the global cancer statistics 2020. Chin Med J (Engl) 2021;134:783–91. - PMC - PubMed
    1. World Health Organization. GLOBOCAN 2020[EB/OL] 2020-10-01.