. 2024;4(1):38.
doi: 10.1038/s43586-024-00318-2. Epub 2024 Jun 13.

Top-down proteomics

Affiliations

Top-down proteomics

David S Roberts et al. Nat Rev Methods Primers. 2024.

Abstract

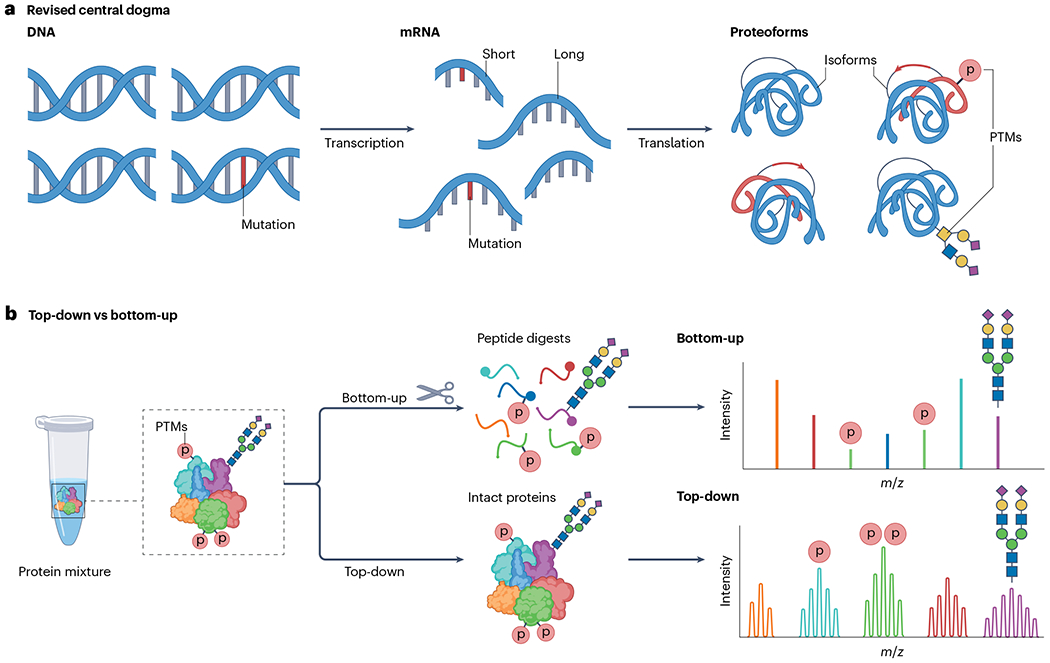
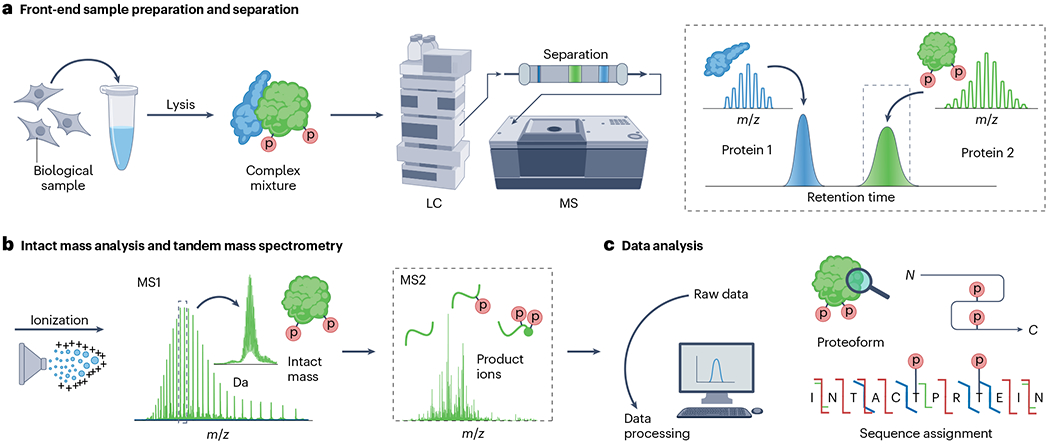
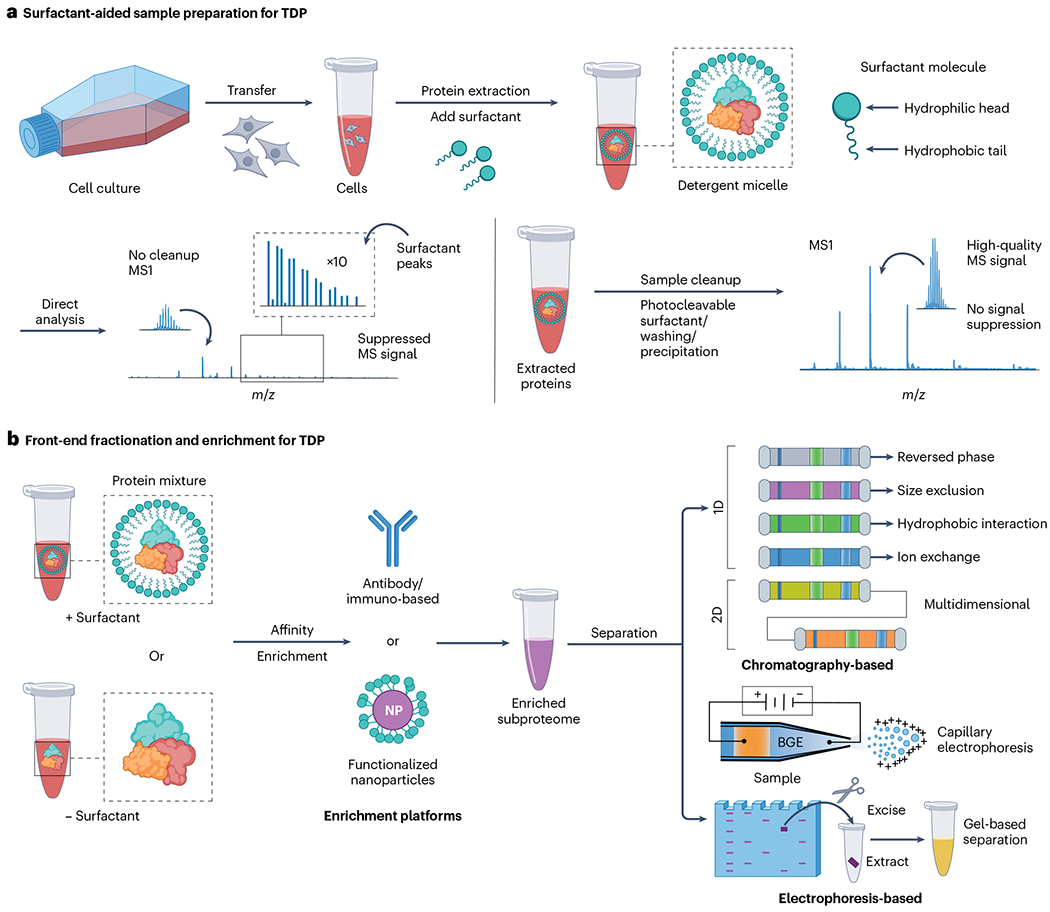
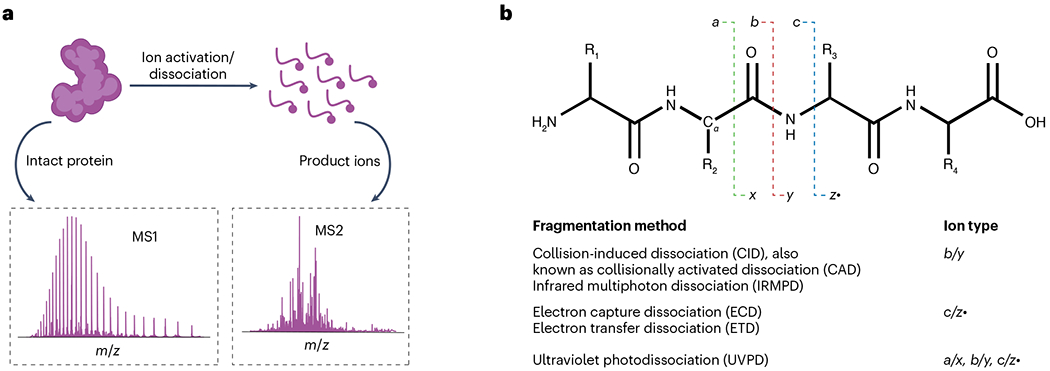
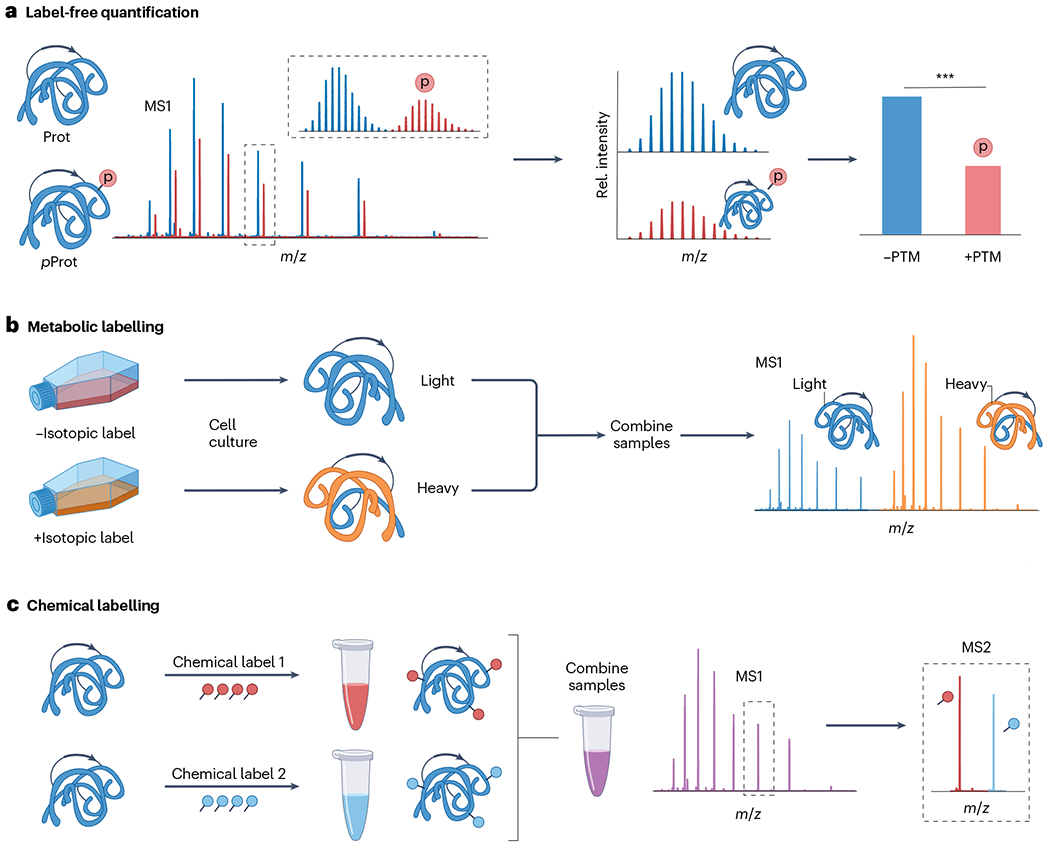
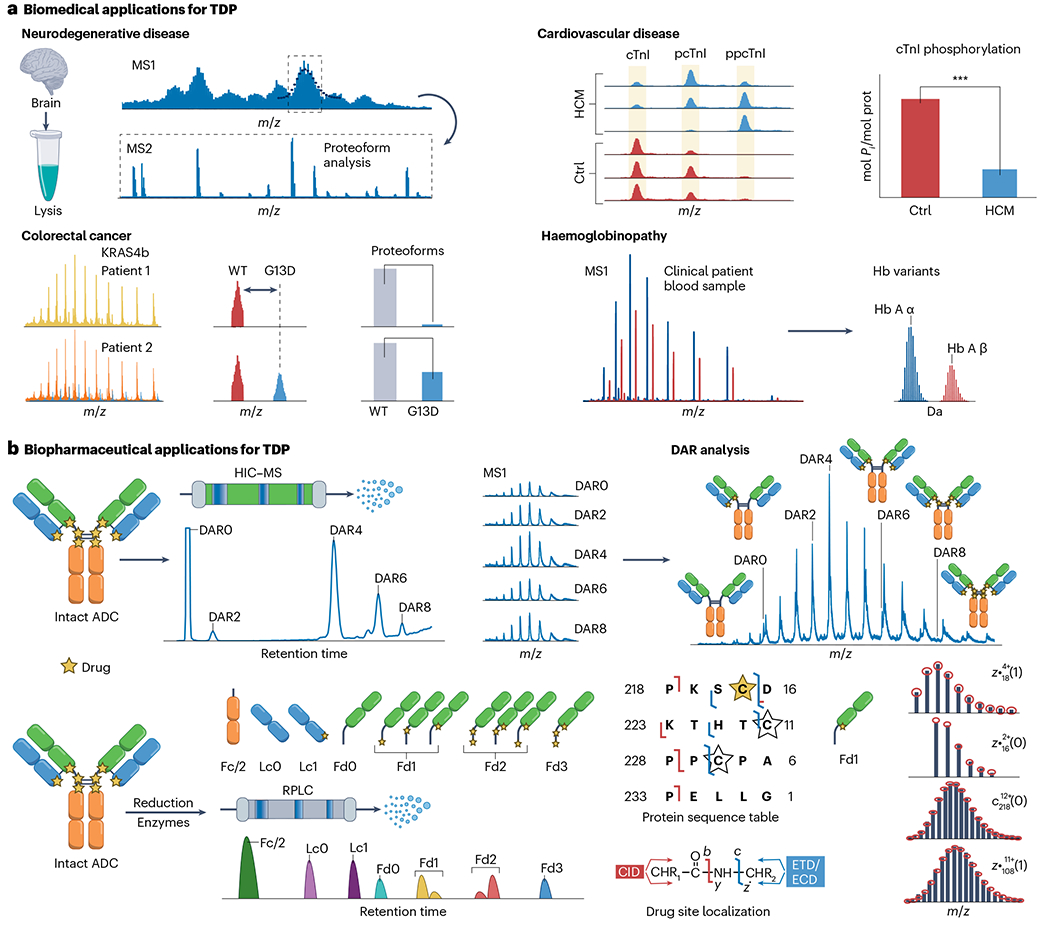
Proteoforms, which arise from post-translational modifications, genetic polymorphisms and RNA splice variants, play a pivotal role as drivers in biology. Understanding proteoforms is essential to unravel the intricacies of biological systems and bridge the gap between genotypes and phenotypes. By analysing whole proteins without digestion, top-down proteomics (TDP) provides a holistic view of the proteome and can decipher protein function, uncover disease mechanisms and advance precision medicine. This Primer explores TDP, including the underlying principles, recent advances and an outlook on the future. The experimental section discusses instrumentation, sample preparation, intact protein separation, tandem mass spectrometry techniques and data collection. The results section looks at how to decipher raw data, visualize intact protein spectra and unravel data analysis. Additionally, proteoform identification, characterization and quantification are summarized, alongside approaches for statistical analysis. Various applications are described, including the human proteoform project and biomedical, biopharmaceutical and clinical sciences. These are complemented by discussions on measurement reproducibility, limitations and a forward-looking perspective that outlines areas where the field can advance, including potential future applications.


Conflict of interest statement

Competing interests J.A.L., J.C.-R., J.N.A., L.P.-T., L.M.S. and Y.G. are currently board members of Consortium for Top-down Proteomics. Y.O.T. is an employee of Spectroswiss, a company that develops data acquisition systems and data processing software for mass spectrometry. X.L. has a project contract with Bioinformatics Solutions Inc., a company that develops data processing software for mass spectrometry. D.S.R. and Y.G. are named as inventors for the patent application US Patent App. 17/786,482. L.P.-T. is named as an inventor for the US Patent App. 17/954,834. Y.G. is named as an inventor for the US Patent App. 18/069,005; US Patent App. 17/978,793; US Patent App. 18/451,614; and US Patent 11,567,085. S.W. declares no competing interests.

Figures

Fig. 1 |
Fig. 1 |. Proteoforms and the top-down approach.
a, A revised central dogma of biology describing the flow of information from DNA to RNA, and, after processing, from RNA to mRNA and finally protein. Genetic variations, alternative splicing and post-translational modifications (PTMs) can form many proteoforms, all originating from the same gene. b, Illustration of the conventional bottom-up proteomics approach that analyses peptides obtained from protein digests and the alternative top-down proteomics approach that analyses intact proteins. The red p represents protein phosphorylation.
Fig. 2 |
Fig. 2 |. The pillars of top-down proteomics.
a, Front-end sample preparation including sample fractionation; in this example, a protein mixture is separated by liquid chromatography (LC). The resulting separated proteins are analysed by high-resolution mass spectrometry (MS) for intact mass measurement (the top portion) and then fragmented (the down portion) to obtain proteoform sequence-informative product ions. b, Data analysis and database searching are performed on the resulting tandem mass spectra for proteoform identification, characterization and quantification. The red p represents protein phosphorylation.
Fig. 3 |
Fig. 3 |. Top-down proteomics sample preparation.
a, General surfactant-aided sample preparation methods for top-down proteomics (TDP). Surfactant-aided preparation typically proceeds by extracting proteins from a biological sample using a chaotropic buffer with a surfactant to efficiently solubilize proteins and yield a complex protein mixture. Without additional cleanup, top-down mass spectrometry (MS) signals suffer from immense signal suppression, leading to low-quality data. With proper sample cleanup using either wash methods, MS-compatible surfactants or protein precipitation methods, high-quality top-down MS data can be acquired. b, Illustration of front-end fractionation and enrichment strategies for TDP. Protein-containing samples are first extracted using a chaotropic buffer with or without (indicated by +/− in the illustration) surfactant. Affinity-based enrichment with antibodies or functionalized nanoparticles (NPs) is often used to enrich specific protein targets or protein families from a complex lysate to give an enriched subproteome. Front-end fractionation of the starting lysate and the enriched subproteome are performed using chromatographic methods – such as reversed-phase liquid chromatography, size exclusion chromatography, hydrophobic interaction chromatography, ion-exchange chromatography or multidimensional liquid chromatography – or electrophoresis-based methods, for instance, capillary electrophoresis or gel-based separation. BGE refers to the background electrolyte used in capillary electrophoresis.
Fig. 4 |
Fig. 4 |. Tandem mass spectrometry techniques for top-down proteomics.
a, Illustration of the process of an intact protein undergoing ionization/dissociation events in a mass spectrometer to yield various fragment ions. The corresponding intact protein precursor ion spectrum (MS1) and product ion spectrum (MS2) are shown for the beginning and end stages of the process. b, Peptide backbone fragmentation scheme showing selected tandem mass spectrometric techniques. Fragment ion nomenclature is depicted with a, x, b, y, c, z· notation depending on the specific cleavage along the amino acid backbone. Various fragment ion types are shown for the common tandem mass spectrometry (MS/MS or MS2) methods used in top-down proteomics.
Fig. 5 |
Fig. 5 |. Fundamental concepts in protein analysis by top-down proteomics.
a, The effects of protein size on mass spectrometry signal to noise (S/N) and charge state distribution under electrospray ionization. A histogram of protein molecular masses for all known proteins in the human proteome is shown. The plot was created using 20,423 entries for Homo sapiens using the UniProt Knowledgebase released on 21 April 2023, and the bin size is 500 Da. Illustration of the decay in S/N as a function of increasing mass resulting from the increasing number of charge states observed for electrosprayed protein ions with the average protein mass (55 kDa) annotated. A typical top-down mass spectrum obtained for a 10 kDa protein under electrospray ionization with all charge states annotated. The most abundant charge state is given by z = 11+. b, Example of the differences in isotopologue distribution between a small (3.4 kDa) and large (45.9 kDa) protein. For sufficiently large protein ions, the monoisotopic mass is no longer observed and the difference between the most abundant and average mass decreases. The monoisotopic mass is the sum of the masses of the atoms in a molecule using the principal (most abundant) isotope for each element, also known as the exact mass. The nominal mass is the sum of masses of the closest integer value of the most abundant mass of an atom. The average mass is the sum of the masses of the atoms from their respective weighted averages. The average mass of a compound is sometimes referred to as the relative molecular mass, denoted by Mr. The most abundant mass is the mass of the highest abundance peak in the entire isotopic cluster.
Fig. 6 |
Fig. 6 |. Overview of top-down proteomics quantification methods.
a, Label-free quantification, which relatively compares the mass spectral signal abundance of various proteoforms between individual liquid chromatography–mass spectrometry (MS) runs. b, Metabolic labelling, including isotopic labelling of proteins in vitro, for comparative MS1 quantification of proteoforms expressed by cells cultured under various conditions. c, Chemical labelling strategies, which involve covalently modifying proteins at specific amino acid residues, generally Lys residues, and the N-terminal domain. Typically, tandem mass tag labelling is used and quantification is performed at the MS2 level. The red p represents protein phosphorylation. PTM, post-translational modification.
Fig. 7 |
Fig. 7 |. Biological applications for top-down proteomics.
a, Schematic depiction of various human organ systems and representative examples of biomedical top-down proteomics (TDP) applications. Four major human disease applications are shown. Neurodegenerative disease involving TDP analysis of hypermodified brain proteins linked to Alzheimer disease. Cardiovascular disease showing the top-down label-free quantification of cardiac troponin I (cTnI) phosphorylation state, which can serve as a biomarker for major cardiac diseases, such as ischaemic cardiomyopathy or hypertrophic cardiomyopathy (HCM). In clinical applications of TDP, haemoglobinopathy involves the top-down mass spectrometry analysis of haemoglobin (Hb) variant characterization from various human clinical blood samples. Colorectal cancer showing the top-down mass spectrometry analysis of various KRAS4b proteoforms to inform disease state. The p and pp represent phosphorylation and bisphosphorylation, respectively. b, Illustration of major biopharmaceutical analysis of antibody–drug conjugates (ADCs). Here, a Cys-based ADC is shown. The top-down approach is ideal for determining the drug-to-antibody (DAR) ratio of ADCs by direct infusion analysis of intact ADCs. Site-specific localization of covalent drug attachment can be achieved through an online top-down liquid chromatography–mass spectrometry (LC–MS) approach. Disulfide reduction and enzymatic treatment can result in a total of seven separated subunits including Fc/2, Lc without drug (Lc0), Lc with 1 drug (Lc1), Fd without drug (Fd0) and Fd with 1–3 drugs (Fd1–3). Electron-transfer dissociation (ETD) and collision-induced dissociation (CID) tandem mass spectrometry characterization of reduced Fd1 isomer of brentuximab vedotin after IdeS digestion are shown, with a corresponding truncated protein sequence table as an example. The stars represent possible conjugation site, with Cys220 (yellow star) the confidently localized Fd1 drug-bound isomer that was identified. Theoretical ion distributions are indicated by the red dots. ECD, electron capture dissociation; HIC–MS, hydrophobic interaction chromatography–mass spectrometry; RPLC, reversed-phase liquid chromatography; WT, wild type.

Similar articles

Cited by

References

    1. Smith LM & Kelleher NL Proteoforms as the next proteomics currency. Science 359, 1106–1107 (2018). - PMC - PubMed
    1. Smith LM & Kelleher NL Proteoform: a single term describing protein complexity. Nat. Methods 10, 186–187 (2013). - PMC - PubMed
    2. This publication introduces and describes the concept and importance of proteoforms.

    1. Smith LM et al. The human proteoform project: defining the human proteome. Sci. Adv 7, eabk0734 (2021). - PMC - PubMed
    2. The outline of an ambitious next-generation initiative to define the human proteome through a definitive set of reference proteoforms.

    1. Aebersold R. et al. How many human proteoforms are there? Nat. Chem. Biol 14, 206–214 (2018). - PMC - PubMed
    1. Melby JA et al. Novel strategies to address the challenges in top-down proteomics. J. Am. Soc. Mass Spectrom 32, 1278–1294 (2021). - PMC - PubMed
    2. A comprehensive summary of the major technical challenges facing top-down proteomics.